
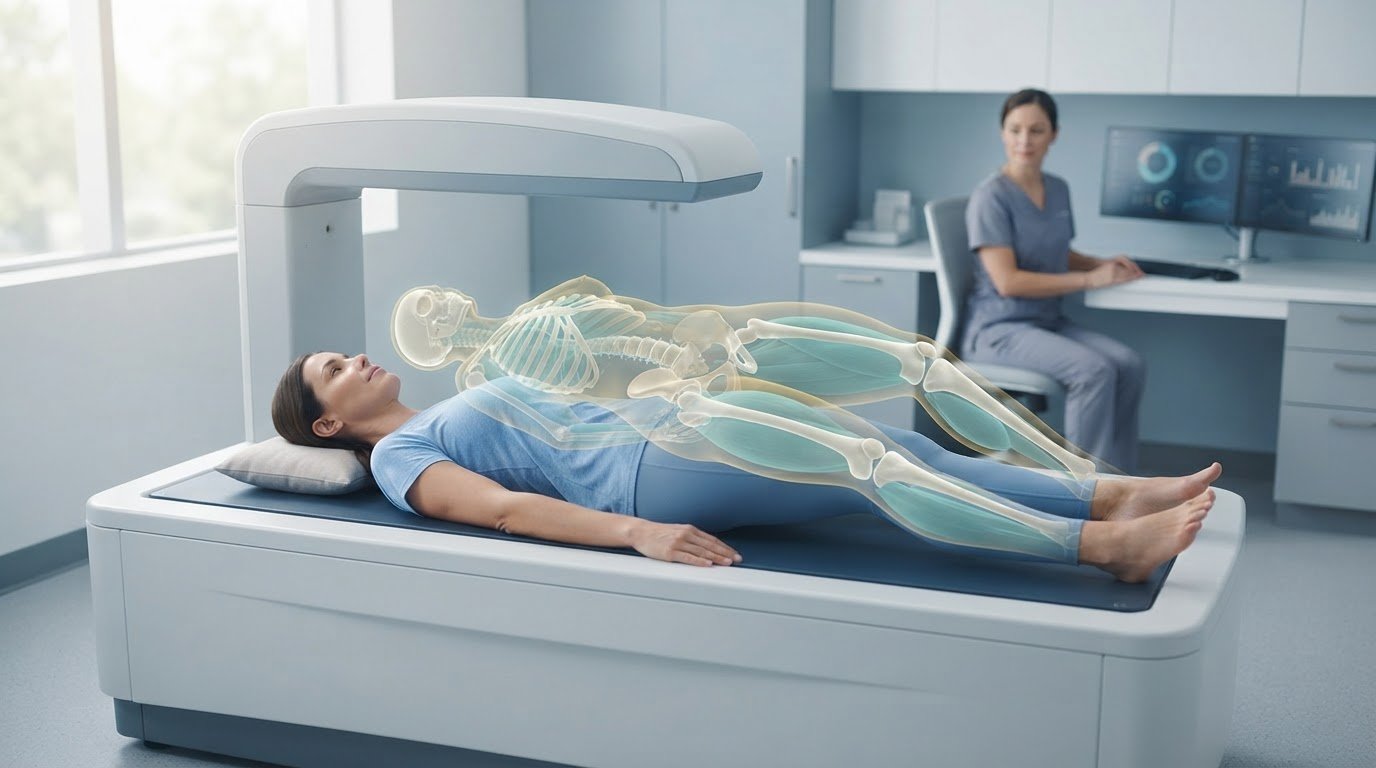
Your weight can stay the same while your body changes. Precision body composition analysis measures how fat, lean tissue, and bone contribute to your body, revealing differences a scale can’t show. DXA, also called DEXA, uses X-ray measurements to map body composition and show how fat is distributed across regions.
It’s reasonable to want a clear picture of whether a change in weight reflects fat loss, muscle gain, or both. This guide explains what body composition analysis measures, how DXA scans work, and how to interpret changes in fat mass and fat-free mass. You’ll also learn why one result is only a snapshot, while consistent measurements can reveal the direction of change.
Key Takeaways
• Separate body fat percentage, fat mass, and fat-free mass to see what a change in weight actually represents.
• Understand how DXA uses measurements to map fat distribution and assess bone density across body regions.
• Interpret measurement reliability in context, including how method and sex can affect comparisons.
• Track trends using consistent measurement conditions rather than treating one scan as the whole story.
• Use a DEXA scan to establish a detailed body composition baseline, then connect the findings to your performance or metabolic goals.
Gender differences in measurement reliability
Reliability asks whether a method produces consistent results when the same person is measured again. In an A-mode ultrasound study of 144 participants, including 81 men and 63 women, intraclass correlation coefficients for body-fat measurements exceeded 0.9 for both testers in all reported measurements except women assessed with the JP3 formula. Across method comparisons, the study generally found coefficients of at least 0.86. These results indicate strong repeatability in that sample, not identical accuracy for every person or formula.
Agreement and reliability answer different questions. A method can repeat its own result consistently yet differ from another method because each uses different measurement principles. Among male participants in the ultrasound study, body-fat percentages did not differ significantly between methods, with all p-values greater than 0.630. That finding applies to the male participants and methods studied; it doesn’t establish equal agreement for women or other technologies. A separate body-composition study included 49 participants, 29 females and 20 males, and used two consecutive measurements for each method. Its analysis found effects of sex and measurement method, showing why results should be interpreted within the method and population assessed.
Technical error of measurement, or TEM, describes the differences between repeated measurements. For example, an examiner can repeat a skinfold measurement at the same position and compare the readings. A larger difference indicates less repeatability under those conditions. Standard error of measurement, or SEM, describes the expected uncertainty around an individual result. TEM focuses on differences between repeated readings; SEM helps indicate how precisely a reported score reflects the underlying measurement. Neither makes an estimate exact.
Clinical and research methods include DEXA, ultrasound, skinfold calipers, and bioelectrical impedance. Each captures body composition differently, so consistency matters: use the same method, device, examiner, and measurement position when tracking change. A reliability recommendation calls for at least two examiners to perform triplicate trials on at least 50 subjects per condition. That design helps separate examiner variation from differences between people. DEXA uses low-dose X-rays, while bioelectrical impedance can shift with hydration and test conditions. These are limitations to interpret, not reasons to treat every result as interchangeable.
Body mass index is a separate screening measure, not a direct body-fat measurement. For adults, a BMI below 18.5 is classified as underweight, according to the Centers for Disease Control and Prevention. The National Heart, Lung, and Blood Institute defines Obesity Class I as a BMI from 30 to 34.9, and Obesity Class III, also called extreme obesity, as a BMI of 40 or above. DEXA and other tests also have limits: DEXA involves ionizing radiation, and results can vary with positioning and analysis. The reported DEXA body-composition exposure is less than one tenth of a chest X-ray’s radiation exposure.
Body fat percentage, fat mass, and fat-free mass
Body-fat percentage shows what share of body mass is fat. Lean mass, visceral fat, and bone density add detail about tissue and fat distribution. Read these measures together to understand a body-composition result, rather than relying on weight alone.
Body Fat Percentage Ranges
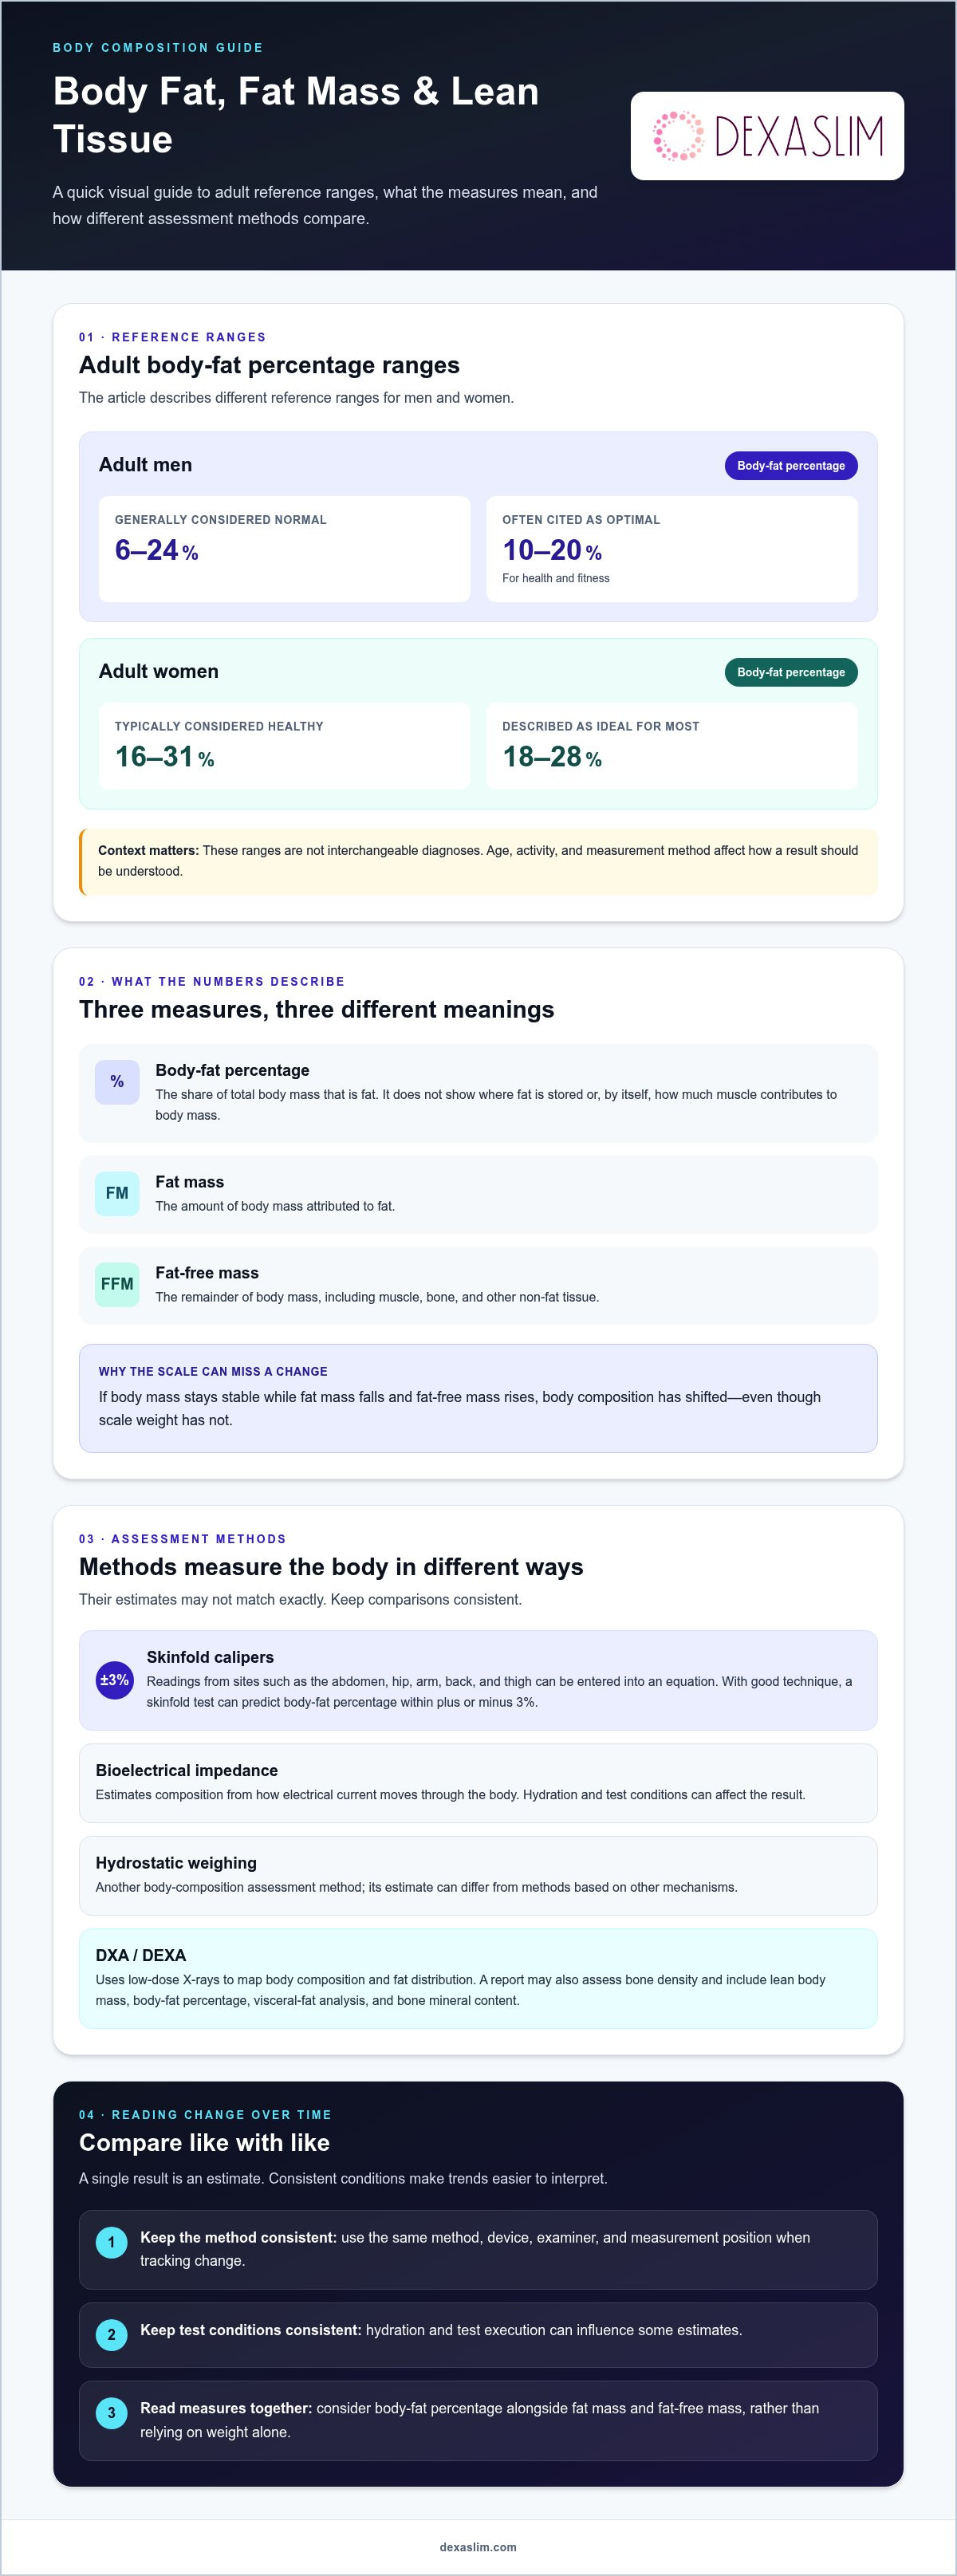
Body fat percentage ranges compare a person’s estimated fat proportion with reference ranges, which differ by sex and by the purpose of the comparison. For adult men, 6-24% is generally considered normal, while 10-20% is often cited as optimal for health and fitness. For adult women, 16-31% is typically considered healthy, and 18-28% is described as ideal for most.
These ranges aren’t interchangeable diagnoses. Age, activity, and measurement method affect how a result should be understood. Use a range as context, then consider it alongside other results and the method used. A single percentage can’t show where fat is stored or how much muscle contributes to body mass.
Estimating Body Fat Percentage
A body-fat estimate uses a measurement method to calculate or assess the proportion of mass attributed to fat. Skinfold assessment uses calipers at sites such as the abdomen, hip, arm, back, and thigh. The readings can be entered into an equation to estimate body-fat percentage and lean mass. With good technique, a skinfold test can predict body-fat percentage within plus or minus 3%.
Bioelectrical impedance analysis estimates body composition by measuring how electrical current moves through the body. Hydration and test execution can affect the result, so compare readings taken under consistent conditions. Hydrostatic weighing is another assessment method. Because these methods use different mechanisms, their estimates may not match exactly. For example, track changes using the same method rather than treating a caliper reading and an impedance result as equivalent.
Fat Mass and Fat-Free Mass
Fat mass is the amount of body mass attributed to fat; fat-free mass is the remainder, including muscle, bone, and other non-fat tissue. These values help explain why two people with the same body mass can have different proportions of muscle and fat. They also show why weight alone can’t tell you whether a change reflects fat loss, muscle gain, or both.
For example, if body mass stays stable while fat mass falls and fat-free mass rises, body composition has shifted even though the scale hasn’t changed. Conversely, a lower weight doesn’t reveal which tissue changed. Assess body-fat percentage alongside the separate mass values. This distinction makes results more useful for evaluating training or nutrition changes than weight alone.
Interpreting Body Composition Results
Lean-mass results estimate non-fat tissue, visceral-fat results describe fat around internal organs, and bone-density results assess mineral content in bone. A DXA report may include lean body mass, body-fat percentage, visceral-fat analysis, and bone mineral content. Each measure answers a different question, so read the full report rather than treating one value as a complete health assessment.
Visceral adipose tissue scores below 100 cm2 are listed as low risk, 100-160 cm2 as higher risk, and above 160 cm2 as highest risk. These categories help distinguish abdominal fat from total fat mass. If bone-density measurement is a priority, Dexaslim’s Bone Density Scan provides a focused way to assess that part of body composition.
DEXA scans
DEXA, also written DXA, uses two X-ray energy levels to assess how tissues absorb radiation. Differences in absorption help estimate fat tissue, lean soft tissue, and bone mineral. Unlike a scale, the scan maps composition across body regions. It can show body-fat percentage and fat distribution, including subcutaneous fat beneath the skin. Regional detail adds context to a total-body result, while bone density provides a separate measure of skeletal tissue.
A DXA report can divide results by areas such as the arms, legs, trunk, and whole body. This makes it possible to compare fat mass and lean mass across regions, rather than seeing only one total. An android-to-gynoid ratio compares abdominal and hip-region fat; a value above 1.0 suggests greater abdominal fat and potentially higher health risk. These measurements describe distribution and composition, not a diagnosis by themselves.
The scan uses a low dose of ionizing radiation. One reported comparison places DEXA body-composition exposure at less than one tenth of a chest X-ray’s exposure, similar to standing outdoors for 3 hours at sea level. A scan takes approximately 10 minutes, with the person lying still for about 7 minutes while the machine collects measurements. Staying in position helps the scanner capture consistent images and calculate regional values.
Preparation can affect comparability between scans. One office recommends booking in the morning while fasting and avoiding water after midnight the night before. After a barium examination or contrast material for a CT or radioisotope scan, the stated guidance allows 10-14 days before DEXA testing. These steps help standardize conditions around the measurement. Follow the instructions provided for the specific scan and keep preparation similar when comparing later results.
Technique matters during image capture and analysis. Movement or inconsistent positioning can affect how the scanner separates tissue compartments and assigns regional measurements. A DXA result is most useful when read as a structured profile: body-fat percentage, fat distribution, lean tissue, and bone density each answer different questions. For example, body weight can remain stable even as the balance of fat and lean tissue changes. Comparing the same regions across scans can make that shift easier to identify.
DXA combines regional body-composition detail with bone assessment in one examination. It doesn’t directly measure every aspect of health or explain why a tissue value changed. Interpret the report in light of the measurement conditions and the goal being assessed. Bone density is a distinct result, not a substitute for measurements of fat and lean tissue.
Tracking body composition changes
Track trends, not isolated readings. One scan is a snapshot; a sequence can show whether fat mass, lean tissue, or fat distribution is changing. Record the method, date, preparation, and relevant conditions with each result. Then compare like with like. Hydration can influence bioelectrical impedance readings, while inconsistent positioning can affect scan comparisons. Consistency makes results more useful, but no single measurement captures every aspect of progress.
Does insurance cover body composition testing in the United States? Coverage depends on the health plan, the clinical reason for testing, and how the service is billed. Don’t assume a scan for fitness tracking is covered; plan benefits and the purpose of testing determine whether insurance pays.
How should I prepare for a body-composition test? Follow the instructions for the specific method and keep conditions consistent across repeat tests. For DEXA, one approach is to schedule a morning appointment while fasting, with no water after midnight the night before. For bioelectrical impedance, hydration can influence the electrical measurement, so record relevant differences rather than comparing unlike conditions as if they were identical.
Use the same method for each comparison. DEXA, skinfold assessment, and bioelectrical impedance assess body composition differently, so their results may not align exactly. If you switch methods, treat the first result from the new method as a fresh baseline. Compare the same reported measures, such as fat mass with fat mass and body-fat percentage with body-fat percentage. This helps distinguish a genuine trend from differences caused by technique or calculation.
For example, an abdominal skinfold reading changes from 35 mm to 24 mm in one reported tracking example. That comparison describes a change at one site, not a direct calculation of total body-fat loss. Skinfold readings depend on consistent placement and technique. A follow-up body-composition scan in 2 to 12 months is suggested in one exercise-monitoring example. The appropriate interval depends on the goal and how much time is needed for a meaningful trend to emerge.
Interpret several measures together. If weight falls while lean mass remains stable and fat mass declines, that pattern differs from weight loss accompanied by a decline in both fat and lean mass. Regional fat distribution can also shift without a dramatic change in total weight. Log the measurements and dates, then look for a consistent direction across results. This helps distinguish short-term variation from sustained change.
DXA body composition analysis
DXA stands for dual-energy X-ray absorptiometry. It uses two X-ray energy levels to estimate how the body is divided into fat, lean tissue, and bone mineral. DXA is therefore a body-composition assessment, not simply a measure of body mass. A report can show total values and regional distribution, helping distinguish abdominal fat from fat stored elsewhere. Its practical value is connecting an overall result with the location of measured tissue.
A DXA report can include total body water, protein content, mineral content, BMI, lean body mass, body-fat percentage, basal metabolic rate, and visceral-fat analysis. These metrics describe different features, so interpret them as a profile rather than a single score. For example, height and weight contribute to BMI, while body-fat percentage estimates the share of mass attributed to fat. Lean body mass captures non-fat tissue, and bone mineral content relates to the skeleton.
Visceral adipose tissue, or VAT, focuses on fat within the abdominal region around internal organs. The listed DXA categories classify VAT scores below 100 cm2 as low risk, 100-160 cm2 as higher risk, and above 160 cm2 as highest risk. These bands give abdominal measurements context. They don’t replace the rest of the report: total fat, regional fat distribution, and lean mass still matter when assessing how body composition changes.
DXA differs from bioelectrical impedance analysis. Impedance uses electrical current through the body to estimate composition, while DXA uses X-ray attenuation at different energy levels. The methods assess tissue differently, so their outputs shouldn’t be treated as interchangeable. Use the same method for comparisons. If a report includes both basal metabolic rate and body composition, remember that an energy-related estimate is a separate metric from a direct measurement of daily energy use.
Read the report in a consistent order: check the measurement method and date, review total body fat and lean mass, then examine regional distribution and bone mineral results. A rise in lean mass alongside a decline in fat mass can indicate a different change from weight loss alone. Track the same report fields across scans, and use consistent preparation and positioning to make comparisons more meaningful. DXA’s value lies in assessing compartments, regions, and bone data together, not in producing a single “best” number.
For a direct baseline, book a DEXA body composition scan and use its regional measurements to track changes in fat and lean tissue.
Dexaslim: 1 Session Dexa Scan
Dexaslim offers a 1 Session Dexa Scan to establish a clear body-composition baseline. Turn to a scan when scale weight alone can’t show whether your body’s fat, lean tissue, or bone measurements have changed. DEXA technology provides detailed body-composition data to help you interpret those measures and track progress against your goals.
Use the results to make your next steps more informed. For a broader performance picture, Dexaslim also offers VO2 Max Performance Testing, Resting Metabolic Rate (RMR) Test, and Longevity Panel. Each addresses a different assessment need, so choose based on the question you want your data to answer.
Ready to make your baseline measurable? Contact Dexaslim or visit dexaslim.com to explore the 1 Session Dexa Scan.
Turn Your Baseline Into a Clear Next Step
Data becomes useful when it helps shape a decision. Set a goal for your next measurement, such as assessing body composition, aerobic performance, or daily energy needs. Then choose the assessment that answers that specific question. Precision body composition analysis can provide a clearer baseline for a deliberate plan, while follow-up measurements help you assess whether your approach is moving in the intended direction.
Dexaslim offers a 1 Session Dexa Scan, VO2 Max Performance Testing, and a Resting Metabolic Rate (RMR) Test. Each provides a different perspective, so start with the result most relevant to your current priority. Use that baseline to make your next health or performance decision with greater clarity.
Contact Dexaslim to discuss your scan and take the next step toward measurable progress.
Frequently Asked Questions
What is Body Composition Analysis?
Body composition analysis estimates how the body’s mass is divided among fat, lean tissue, and bone. It adds context that body weight alone can’t provide. For example, two people with the same weight may have different proportions of muscle and fat. The right interpretation depends on the measurement method and the question being assessed, such as tracking fitness changes or evaluating regional fat distribution.
What is the Gold Standard for determining Body Fat?
There isn’t one gold standard for every body-fat question. The best method depends on whether you need a regional estimate, a whole-body comparison, or a practical way to track change. DXA provides regional body-composition and bone measurements, while other methods use different approaches. Treat “gold standard” as context-specific, and compare results from the same method rather than assuming every technology produces equivalent values.
What is precision body composition analysis and what does it measure?
Precision body composition analysis uses a defined method to assess body tissues beyond total weight. Depending on the technology and report, it can assess fat mass, lean tissue, body-fat percentage, regional fat distribution, and bone measures. Its practical value is providing a more detailed baseline for a specific goal. For example, someone monitoring strength training may focus on changes in lean tissue alongside changes in fat mass.
Which methods are most accurate for body composition analysis: DEXA, Bod Pod, bioelectrical impedance, or skinfolds?
No method is automatically the most accurate for every person and purpose. DEXA reports regional composition and bone measures; a Bod Pod estimates composition using air displacement; bioelectrical impedance relies on electrical measurements; and skinfolds depend on caliper placement and technique. Choose based on the result you need, then repeat the assessment using the same method. Switching technologies can make readings difficult to compare directly.
How accurate and repeatable are body composition analysis results?
Accuracy describes how close a result is to the value being estimated; repeatability describes how consistently a method produces readings under similar conditions. A test can be repeatable without matching another method’s estimate. For useful comparisons, record the method and follow its preparation instructions each time. Interpret small shifts cautiously, especially when they don’t align with other measures, such as training performance or changes in clothing fit.
How often should I repeat a body composition analysis?
Repeat testing after enough time has passed for the changes you’re monitoring to become meaningful. The right schedule depends on your goal, the measurement method, and the pace of your training or nutrition changes. Testing too frequently can make ordinary variation look like progress or regression. Plan a comparison point, keep the method consistent, and assess the trend alongside relevant performance or health measures.