
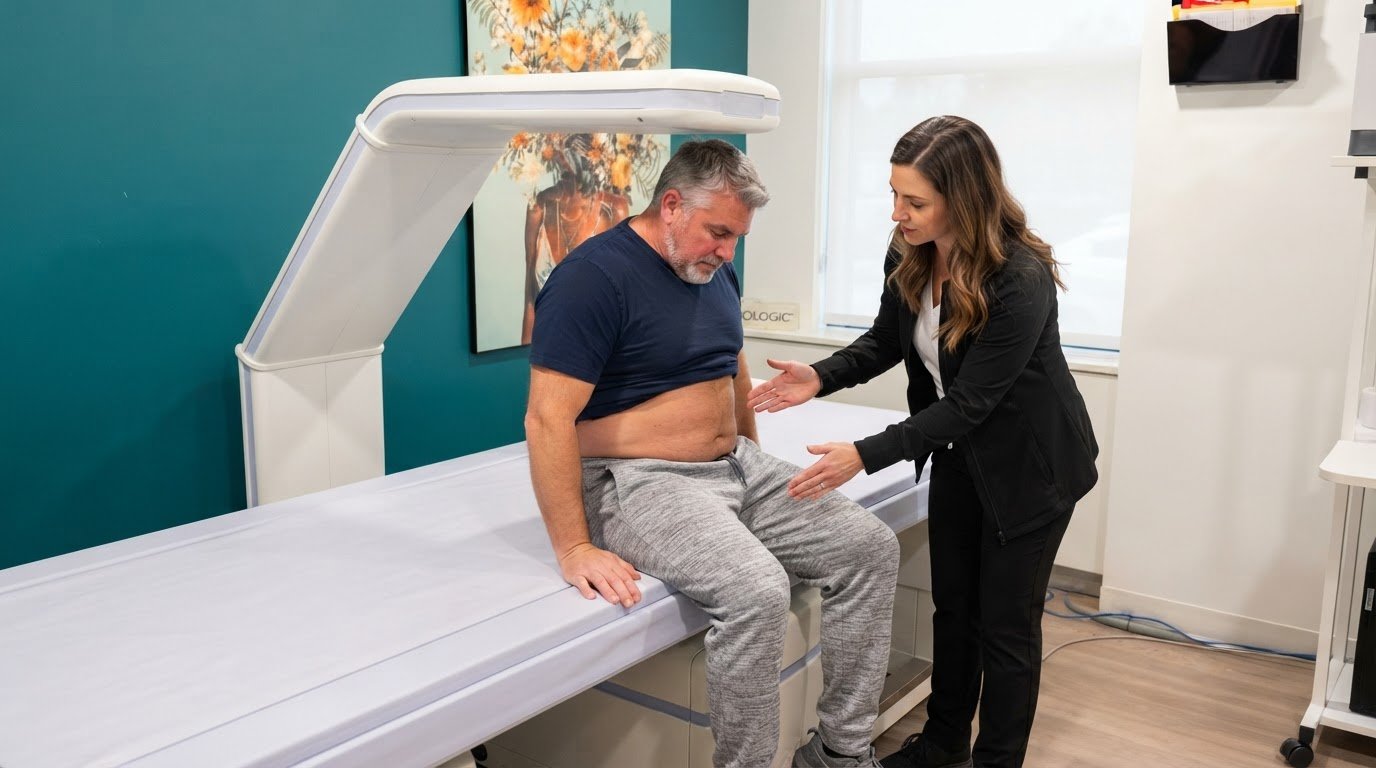
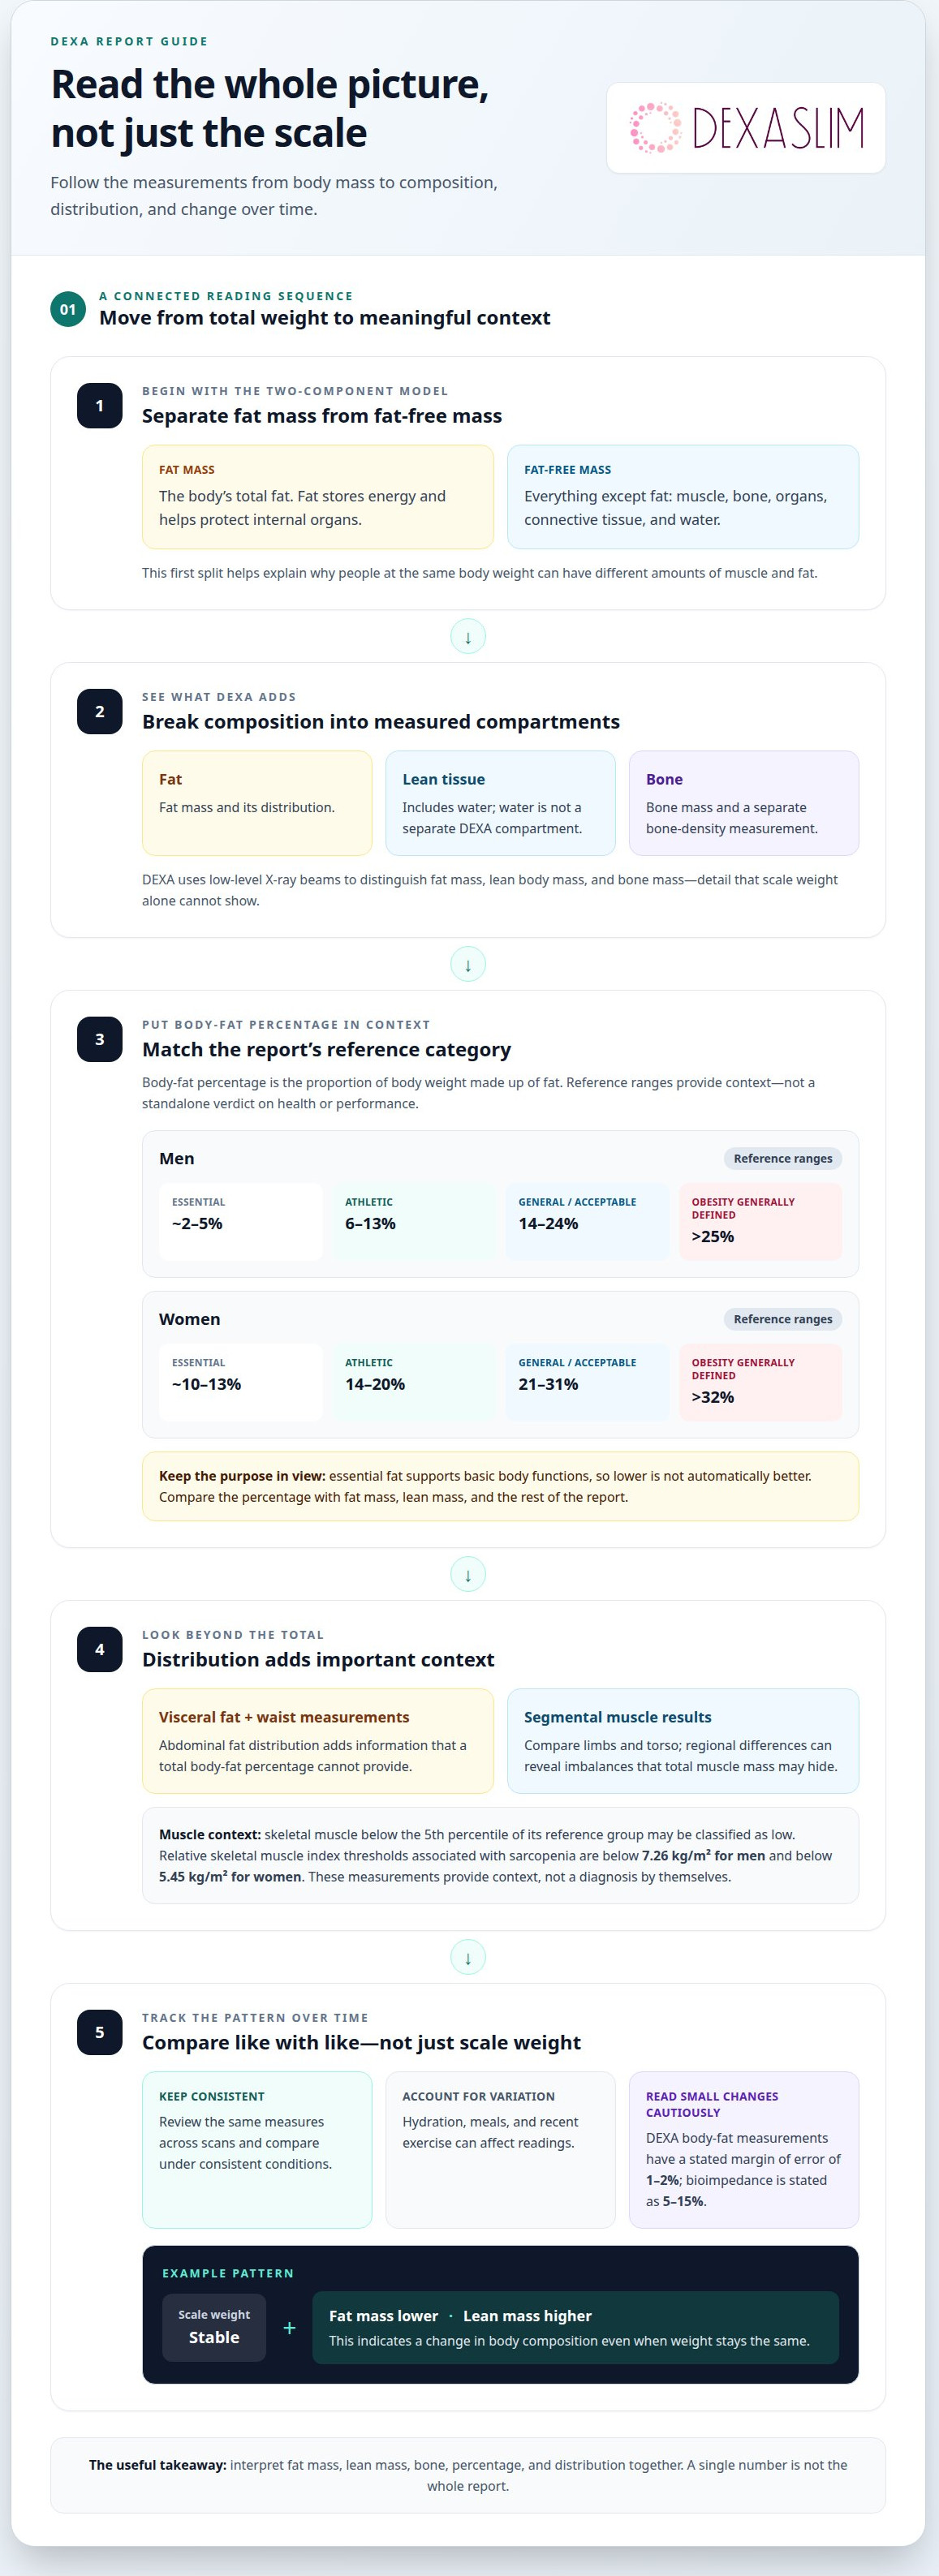
Your weight can stay the same while your body composition changes. Understanding my body composition report starts with the two-component model: it separates total body mass into fat mass and fat-free mass, which includes muscle, bone, organs, connective tissue, and water. A DEXA scan adds detail by distinguishing fat, lean tissue, and bone.
It’s natural to focus on the number on the scale. But weight alone can’t show whether you’re losing fat, preserving muscle, or changing the balance between them. Read your report as a set of connected measurements, not a single verdict.
This guide explains what the main measurements mean, how DEXA assesses body fat and lean mass, why visceral fat matters, and how to interpret changes between scans. You’ll also learn how to use your report as a baseline for tracking progress, including when weight alone doesn’t tell the full story.
Key Takeaways
• Read a DEXA report as a set of connected measurements, not a single number on the scale.
• Use the two-component model to distinguish fat mass from fat-free mass, then explore how DEXA breaks body composition down further.
• Interpret body fat percentage alongside the relevant reference range and the rest of your report.
• Pay attention to visceral fat and waist measurements because fat distribution adds important context to overall body composition.
• Compare scans over time under consistent conditions to see whether lifestyle changes are shifting fat and lean mass.
What Is a DEXA Scan for Body Fat?
A DEXA scan uses low-level X-ray beams to distinguish fat mass, lean body mass, and bone mass. Its report adds detail beyond body weight, showing how fat and lean tissue are distributed.
Body composition describes the proportions of fat, bone, water, and muscle in the body. DEXA separates bone, fat, and lean tissue; water is part of lean mass, not a separate DEXA compartment. This distinction matters because two people at the same weight can have different amounts of muscle and fat.
Body Fat, Bone, Water, and Muscle
Each component serves a different role: fat stores energy, bone provides structure, and muscle supports movement. Water is present throughout the body, including in muscle and other lean tissues. A DEXA report’s fat mass, lean mass, and bone-density measurements help explain what weight alone cannot, such as whether a change reflects fat loss or a shift in lean tissue.
Skeletal and Segmental Muscle Mass
Skeletal muscle mass is muscle attached to bones, while segmental results show muscle distribution across the limbs and torso. Comparing these regions can reveal imbalances that total muscle mass may hide. A report may classify skeletal muscle below the 5th percentile of its reference group as low. Relative skeletal muscle index thresholds associated with sarcopenia are below 7.26 kg/m² for men and below 5.45 kg/m² for women; these measurements provide context, not a diagnosis by themselves.
Tracking Muscle and Fat Changes
Compare DEXA results over time to see whether fat and lean mass are shifting, even if weight stays steady. For a useful comparison, review the same measures across scans rather than relying on scale weight alone. For example, stable weight with lower fat mass and higher lean mass indicates a different change in body composition than stable weight with unchanged measurements.
During weight loss, focus on reducing excess fat while preserving lean muscle and staying hydrated. Strength-focused exercise and adequate nutrition support that goal; rapid changes on the scale alone cannot show which tissue changed. Track fat and lean mass together to put weight changes in context.
DEXA also reports bone density, adding a separate measure to the body-composition picture. Review it alongside fat and lean mass rather than treating any one result as a complete assessment. Together, these measurements create a more precise baseline for tracking changes in body composition.
What Does Your Body Fat Percentage Actually Mean?
Body fat percentage is the proportion of total body weight made up of fat mass. A reading of 20% means one-fifth of measured body weight is fat, while the remaining portion includes lean tissue and bone. Understanding my body composition report starts with recognizing that this percentage describes composition, not the amount or location of fat by itself.
Use the range that matches the report’s sex-based reference category, then interpret it with the rest of the measurements. General reference ranges place men at 14–24% and women at 21–31%. Athletic ranges are lower: 6–13% for men and 14–20% for women. These categories offer context, not a standalone verdict on health or performance.
Men
Essential body fat is around 2–5%; athletic ranges are 6–13%, and general fitness or acceptable ranges are 14–24%. Body fat over 25% is generally defined as obesity.
Women
Essential body fat is about 10–13%; athletic ranges are 14–20%, and general fitness or acceptable ranges are 21–31%. Body fat over 32% is generally defined as obesity.
Essential fat supports basic body functions, so a lower percentage is not automatically better. Nobody can have 0% body fat, and maintaining less than 4% is generally regarded as inadvisable for long-term health. Body fat also stores energy, protects internal organs, insulates the body, and helps regulate temperature. The goal is useful context, not the smallest possible number.
Compare body-fat percentage with fat mass and lean mass. The same body-fat percentage can represent different amounts of total fat in people with different body weights. A DEXA report can show total body fat and regional distribution, helping distinguish a percentage change from a shift in where fat is distributed. Visceral fat is a separate consideration: abdominal fat distribution adds information that a total percentage alone cannot provide.
DEXA body-fat measurements have a stated margin of error of 1% to 2%, so treat small differences cautiously rather than reading every decimal as a meaningful shift. A practical approach to understanding my body composition report is to compare repeat scans and review the broader pattern across fat mass, lean mass, and regional measurements. A single percentage cannot explain whether a change came from fat loss, muscle gain, or both.
For a clearer baseline, a DEXA body composition scan can show body fat alongside other measured components. Use the percentage as one data point, then interpret it within the report’s reference ranges and your overall body-composition pattern.
What are the 2 components model of body composition?
The two-component model divides body weight into fat mass and fat-free mass. BMI relates weight to height, skeletal muscle mass measures muscle, and fat-free mass includes everything except fat. DEXA’s stated body-fat error is 1–2%, compared with 5–15% for bioimpedance. Hydration, meals, and recent exercise can affect readings.
Fat Mass and Fat-Free Mass
Fat mass is the body’s total fat, while fat-free mass includes muscle, bone, organs, connective tissue, and water. This distinction helps show whether body weight reflects fat or nonfat tissue. Lean body mass and fat-free mass are related measures, and report labels can distinguish them. Check your report’s labels before comparing these values.
Fat serves as an energy store and protects internal organs; fat-free mass includes tissues with different roles. Water makes up about 73% of fat-free mass, so hydration can influence measurements that estimate body composition. A report example lists fat-free mass, including lean mass and bone mineral content, at 58.5 kg. That figure offers context beyond total weight.
Fat and Fat-Free Mass Indexes
Fat Mass Index (FMI) and Fat-Free Mass Index (FFMI) adjust the measured tissue amount for height, making comparisons more informative than kilograms alone. One report example lists an FMI of 8.47 kg/m² and a Lean Mass Index of 18.2 kg/m². Its Appendicular Lean Mass Index is 7.72 kg/m², focusing on lean tissue in the limbs.
Reference ranges add context, not a universal target. Reported FMI ranges are 5–9 kg/m² for women and 3–6 kg/m² for men. Appendicular lean mass measures lean tissue in the arms and legs; its index relates that amount to height. Read these measures together to see whether a body-weight change reflects fat, whole-body lean tissue, or limb lean tissue.
How DXA Measures Body Components
DXA uses low-level X-ray beams to distinguish bone mass, fat mass, and lean body mass. It provides separate measurements instead of treating the body as a single weight figure. The two-component model groups everything into fat and fat-free mass; DXA offers a more detailed breakdown by identifying bone separately.
Test methods differ in how they estimate body composition. Bioelectrical impedance uses a small electrical current, while DEXA uses X-rays; both methods estimate body composition, and their results can vary. For more consistent comparisons, arrive well hydrated, avoid food for at least three hours before a DXA scan, and avoid intense exercise within 12 hours. These factors can shift readings, so consistent preparation supports clearer trend comparisons.
Visceral fat and health risks
Visceral adipose tissue is fat stored around internal abdominal organs, while subcutaneous fat sits beneath the skin. Interpret each measurement in context: a visceral-fat estimate and waist circumference provide different information, and neither alone describes overall health.
Visceral Adipose Tissue
Visceral adipose tissue, or VAT, is fat around abdominal organs; higher levels are associated with cardiovascular and metabolic disease risk. Unlike subcutaneous fat, it cannot be measured simply by pinching the tissue beneath the skin. Because of its location, VAT is a distinct data point, and abdominal appearance alone cannot precisely indicate how much is present.
DEXA body-composition scans do not directly measure visceral fat. Some reports estimate VAT area using other methods, while bioelectrical impedance analysis uses a small electrical current to estimate body composition. Waist circumference and BIA data can help estimate visceral fat. Treat these results as specific to their measurement method, not as interchangeable readings.
Visceral Fat Risk Thresholds
A visceral adipose tissue area over 100 cm² is often considered a threshold for elevated risk. Reported elevated-risk measurements are around 100–160 cm², while one report example gives 29.3 cm² and classifies it within the normal range. These figures help interpret a report’s scale; they are not the same as a waist measurement.
Waist circumference adds a practical marker. The National Heart, Lung, and Blood Institute considers waist circumference above 35 inches high for women and above 40 inches high for men. Keep the unit and sex-based reference clear when reading this measure. A waist circumference is not a direct measure of visceral fat density, but it gives another useful context point.
Interpreting Visceral and Subcutaneous Fat
Read visceral and subcutaneous fat as separate measurements, not competing scores. A higher VAT estimate can signal greater cardiovascular and metabolic risk, while a subcutaneous-fat figure describes fat beneath the skin. If your report includes both, compare each with its own reference range instead of combining the values into one total.
Use the same method and conditions to track progress across repeated measurements. For example, compare VAT area with the previous VAT-area result, then review waist circumference separately. DEXA can show regional fat distribution, but it cannot provide a direct VAT reading. Combining available measures creates a more precise picture to inform personalized fitness decisions, without treating any one result as a diagnosis.
Using body composition analysis to track lifestyle changes
Body-composition analysis turns lifestyle changes into measurable tissue trends. Compare fat mass, lean mass, and total body weight together; the scale alone cannot show which tissue changed. Weight can stay steady while fat and muscle shift, so a report may reveal progress that weight tracking misses. A practical way to approach understanding my body composition report is to look at these measures as a connected pattern.
Set a baseline before changing exercise or nutrition. Then compare follow-up results using the same measurement method and focus on the direction of change across related measures. Checking body composition every 3 to 6 months is a reasonable cadence for monitoring broader trends. More frequent measurements can make ordinary fluctuations harder to distinguish from sustained change.
Interpret the pattern in light of your goal. During weight loss, the aim is to reduce excess fat while preserving lean muscle. A lower body weight paired with a large drop in lean mass tells a different story from lower fat mass with lean mass maintained. Review both tissue measures before judging a plan by pounds lost.
Body recomposition is also possible, particularly for people new to resistance training. In this pattern, fat mass may decrease while muscle increases, leaving total weight relatively steady. If the scale barely moves but repeat analysis shows less fat and more lean tissue, the composition trend reveals change the scale misses.
Use your results to refine the next phase of exercise and nutrition. Body-composition findings can help fitness professionals tailor plans to individual needs, while cardiovascular training and strength work address different performance goals. During weight loss, combine dietary adjustments with exercise to support lean-mass preservation. Understanding my body composition report means using each result to refine a plan, not treating it as a score that defines success.
Visceral adipose tissue offers another progress marker when the assessment includes it. Structured exercise and dietary adjustments can produce measurable reductions in visceral adipose tissue within 8 to 12 weeks. Compare the same reported measure over time, then interpret it alongside changes in other tissue and your broader health goals. A single estimate does not show the whole response.
Consistency makes comparisons useful. Keep a record of scan dates, the method used, and lifestyle changes between assessments. Link changes in training or nutrition to the next report, then evaluate whether the expected tissue trend appears. This creates a practical feedback loop: establish a baseline, follow your plan, measure again, and refine it based on the results.
Plan a DEXA body composition scan to establish a measurable baseline for tracking lifestyle changes.
Dexaslim
Dexaslim helps turn body composition results into a clearer baseline for tracking health and performance. A 1 Session Dexa Scan can measure body composition, while VO2 Max Performance Testing and a Resting Metabolic Rate (RMR) Test add information about aerobic capacity and resting energy needs. A Longevity Panel provides another way to assess health markers.
Choose an assessment that matches your question: body composition, exercise performance, metabolic needs, or a broader view of longevity. These measurements can provide objective context when you’re setting goals or reviewing changes over time.
Contact Dexaslim to discuss which assessment fits your goals.
Turn your report into a clear next step
Understanding my body composition report becomes useful when the data guides a specific decision. Choose the outcome you want to work toward, then decide which measurement will help you assess progress. A clear focus makes future results easier to interpret and keeps your plan grounded in evidence rather than assumptions.
Keep your next step practical. You might want a more precise baseline, a clearer view of how your body responds to a training plan, or added context for your metabolic goals. Match the assessment to the question you want answered. That turns a report from a collection of numbers into a tool for deliberate action.
Dexaslim offers body composition and metabolic assessments, including a 1 Session Dexa Scan, VO2 Max Performance Testing, and a Resting Metabolic Rate (RMR) Test. If you’re ready to discuss which assessment fits your goals, contact Dexaslim about your scan. Use the information to set your direction, then keep moving forward with purpose.
Frequently Asked Questions
What Does Your Android-to-Gynoid Ratio Reveal?
The android-to-gynoid ratio compares abdominal fat with fat around the hips and thighs. A value above 1 indicates more abdominal fat relative to fat in the hips and thighs. Reference points differ by sex: below 0.8 is identified as an ideal value for women, while below 1.0 is identified as ideal for men from a health-risk standpoint. Treat the ratio as one report measure, not a diagnosis.
What Should You Do With Your DEXA Results?
Use the results to establish a baseline and choose the measurements that matter for your goal. For example, someone focused on strength can follow lean tissue, while someone monitoring skeletal health can track bone density. Compare like-for-like measurements over time. A whole-body bone-density scan cannot diagnose osteoporosis, so use it as screening information and discuss concerning findings with a physician.
What is DXA?
DXA, also written DEXA, is a scan method that uses low-level X-ray beams to assess body composition. It distinguishes fat mass, lean body mass, and bone mass, giving more detail than body weight alone. A DXA report can also show how fat is distributed across body regions. It does not directly measure visceral fat, so don’t interpret regional-fat results as direct VAT readings.
What is the Importance of Body Water?
Body water supports temperature regulation, transports nutrients and waste, and provides a medium for chemical reactions. It is also a major component of blood. Because water contributes to lean tissue, changes in hydration can affect body-composition estimates. Read water-related results in context rather than treating a single measurement as a direct measure of fitness, fat loss, or muscle gain.
What measurements are included in a body composition report?
A report can include total body fat, fat mass, lean mass, and bone density. Some reports also show regional fat distribution and muscle measurements by body segment. Check the report’s labels and units before comparing results: a percentage describes a proportion, while a mass value describes an amount. Not every method provides the same measurements, and DXA does not directly measure visceral fat.
How do I interpret body fat percentage by age and sex?
Start with the comparison category and reference range printed on your report. DEXA reports may compare results with standardized charts for age and gender, so use the chart that matches your report rather than applying one cutoff to everyone. General fitness ranges differ by sex, and athletic categories differ too. Treat the percentage as context alongside fat mass, lean mass, and regional distribution.
What is a healthy body fat percentage range for adults?
General fitness or acceptable ranges are 14–24% for men and 21–31% for women. Athletic ranges are 6–13% for men and 14–20% for women. These are reference categories, not personal targets for every adult. Interpret your value using the report’s reference group and other measurements. Body fat also has essential functions, so the lowest possible percentage is not the goal.
What do total body water and protein levels indicate on a body composition report?
Total body water estimates the water component of the body, which supports functions such as temperature regulation and nutrient transport. In the four-component model, protein is listed alongside water, minerals, and fat. The meaning of a displayed protein value depends on the measurement method and report definitions. Review its units and method before comparing it with another assessment.