

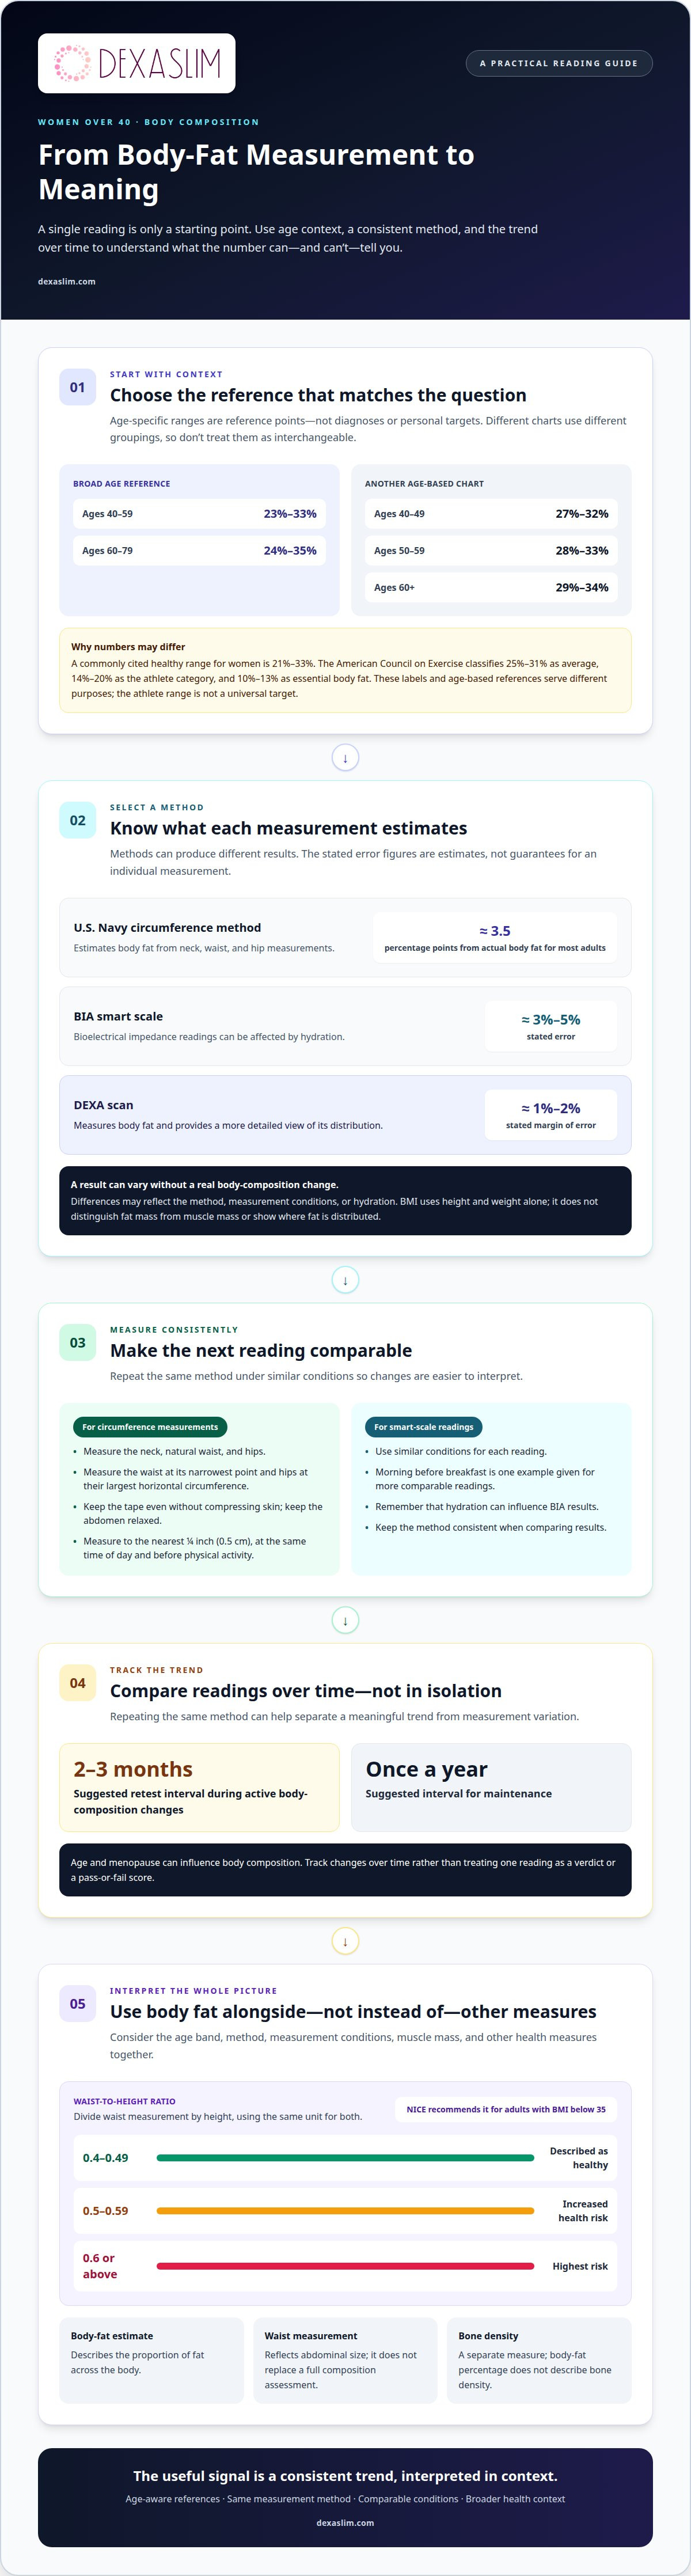
A single body-fat number can’t define a woman’s health after 40. For women aged 40-59, 23% to 33% is one reference range; calculating body fat percentage for women over 40 means interpreting that estimate alongside age, body composition, and health context, not treating it as a pass-or-fail score.
It makes sense to want a clear benchmark when weight or BMI doesn’t reflect changes in muscle and fat. BMI uses height and weight alone, so it can’t show how much of your body is fat or where that fat is distributed. Age and menopause can also influence body composition, making an age-aware measurement more useful than an isolated number.
This guide explains typical body-fat ranges for women in their 40s and beyond, how to calculate an estimate, and how to understand its limits. You’ll also learn why measurement methods can produce different results and how a DEXA scan can provide a more detailed picture of body fat and its distribution.
Key Takeaways
• Use age-specific body-fat ranges as context, not as a single pass-or-fail target.
• Interpret BMI carefully: height and weight alone don’t reveal body-fat percentage or distribution.
• Account for age and menopause when assessing changes in body composition over time.
• Compare measurements taken with the same method and under consistent conditions for a clearer trend.
• Consider a DEXA scan when you want a more detailed view of body fat and where it is distributed.
What percent body fat should a female be?
There isn’t one body-fat percentage that defines health for every woman. A commonly cited healthy range for women is 21% to 33%, while age, muscle mass, and measurement method affect how an individual result should be interpreted. The American Council on Exercise classifies 25% to 31% as average for women, 14% to 20% as the athlete category, and 10% to 13% as essential body fat. Essential fat supports basic functions; the athlete range isn’t a universal target.
For women over 40, calculating body fat percentage is most useful as a consistent measure over time, not a verdict based on one reading. Equations estimate body fat from assumptions about body size and composition. They don’t directly measure fat, and different methods can produce different results. BMI uses height and weight, so it can’t distinguish fat mass from muscle mass or show where fat is distributed. Hydration can also affect body-fat readings, especially with bioelectrical impedance analysis, or BIA.
Each method has limits. The U.S. Navy circumference method estimates body fat from neck, waist, and hip measurements; its estimates can fall within approximately 3.5 percentage points of actual body fat for most adults. BIA smart scales can have an error of approximately 3% to 5%. DEXA measures body fat and its distribution, with a stated margin of error of approximately 1% to 2%. These figures are estimates, not guarantees for an individual measurement. Differences between results may reflect the method, measurement conditions, or hydration rather than a real change in body composition.
For the U.S. Navy method, a trained professional measures the neck, natural waist, and hips. The waist is measured at its narrowest point, and the hips at their largest horizontal circumference. The tape should sit evenly without compressing the skin. The person being measured should keep their abdomen relaxed, not pull it in. For more consistent calculator results, measurements should be taken to the nearest 1/4 inch (0.5 cm).
Consistency improves comparisons. Circumference measurements are best taken at the same time of day and before physical activity. Smart-scale readings are more comparable when collected under similar conditions, such as in the morning before breakfast. During active body-composition changes, retesting every 2-3 months can help track a trend; for maintenance, once a year is a suggested interval. Repeating the same method helps separate meaningful change from measurement variation.
Waist circumference adds context, but it doesn’t replace a full body-composition assessment. Waist measurement reflects abdominal size, while a body-fat estimate describes the proportion of fat across the body. Consider the method, measurement conditions, and trend together. A result is more informative when interpreted alongside muscle mass and other health measures, rather than used alone to set a target.
Age-specific body-fat percentage ranges for women
Age changes the context for interpreting body-fat percentage, but it doesn’t create one universal target. A reference range for women aged 40-59 is 23% to 33%; for women aged 60-79, it is 24% to 35%. These broad ranges differ from category charts, which divide results into narrower groups. Use them to assess a measurement, not to diagnose health or prescribe a personal goal.
One age-based chart gives these average ranges:
• Women aged 40-49: 27% to 32%.
• Women aged 50-59: 28% to 33%.
• Women aged 60 and older: 29% to 34%.
Another classification groups women aged 40-49 into ranges from under 14% to over 31.9%, with intermediate categories labeled excellent, good, fair, and poor. For ages 50-59, its excellent category spans 14% to 22.5%, while the highest category begins above 34.6%. Such labels depend on the chart’s classification system. They shouldn’t be treated as interchangeable clinical thresholds.
Differences between charts matter. One reference describes the typical healthy range for women as 21% to 33%, while the broad age bands begin at 23% for ages 40-59. A category called “average” may describe a population distribution, not an individualized health target. The measurement method, age group, and purpose of the reference all affect interpretation. Body mass index adds another limited comparison: it uses height and weight, but doesn’t directly show body-fat percentage or density.
Waist-to-height ratio offers a separate way to assess abdominal size relative to height. Divide the waist measurement by height using the same unit for both. A ratio from 0.4 to 0.49 is described as healthy; 0.5 to 0.59 is associated with increased health risk, and 0.6 or above with the highest risk. The National Institute for Health and Care Excellence recommends this measure for adults with a BMI below 35. It complements, rather than replaces, a body-fat assessment.
Nutrition, muscle mass, and bone health provide different pieces of the picture. A body-fat percentage alone can’t describe bone density, and a waist-to-height ratio doesn’t measure total body composition. For a separate assessment of bone health, a bone density scan addresses a different measure than body-fat percentage.
Choose the age band that matches the person being assessed, then interpret the range alongside the measurement method and other relevant measures. Don’t overread a result near a category boundary, especially since reference charts may use different groupings. The useful question is whether consistently collected measurements show a meaningful trend, not whether one number fits every chart.
Body-fat changes after age 40 and menopause
Age and hormonal shifts can affect both body-fat percentage and where fat is carried. Track body composition over time instead of interpreting a single measurement in isolation.
Body Fat Changes With Age
Body fat can rise as lean mass changes with age, shifting the balance that a percentage represents. Inactive women lose 3% to 8% of lean mass per decade, beginning in their 30s, while women accrue 1 to 2 percentage points of body fat every 10 years. These patterns make the same body weight a different composition over time.
That distinction matters because body mass index uses weight and height, not muscle or fat distribution. A stable scale reading can therefore mask changes in muscle and fat mass. The cited DXA reference data found median body fat rose about 2% per decade from the twenties through the fifties in both sexes. This is a population pattern, not a prediction for each woman.
Exercise and strength-focused activity can help preserve muscle as part of an overall body-composition strategy. Interpret changes in percentage alongside the measurement method: skinfold measurements assess fat beneath the skin, not visceral fat around internal organs. A method that captures fat distribution can provide different information from skinfold results or a mass index.
Hormones and Menopause-Related Changes
Hormonal changes around age 40 and menopause can influence body-fat patterns. Hormonal changes around menopause may influence body-fat distribution, while changes in lean mass can also affect overall body composition. That combination can shift measurements without a dramatic change in scale weight.
A woman’s ideal body-fat percentage might be higher after age 40, so a younger adult’s target may not fit her current context. Compare age-appropriate measurements, and consider whether the method assesses total fat, subcutaneous fat, or distribution. A skinfold result, for example, cannot represent every fat compartment.
Menopause timing and individual body composition vary, so use trends rather than a single reading to guide interpretation. If your percentage rises while your weight stays steady, reduced muscle mass may be part of the change. If you change measurement methods, the new result may not be directly comparable with earlier readings.
Use a consistent assessment method and record the date and conditions each time. During active change phases, retesting every 2-3 months can help reveal a trend; for maintenance, annual measurement is a suggested interval. Pair body-fat results with other measures relevant to the goal. This creates a clearer baseline than relying on mass index or weight alone.
Average body fat percentages for women by age
An average describes a group, not an individual target. One age-based chart places women aged 40-49 at 27% to 32%, women aged 50-59 at 28% to 33%, and women aged 60 and older at 29% to 34%. Those figures offer a reference point, but another U.S. dataset reports higher averages. The difference makes the dataset and measurement method essential context.
Reported U.S. averages from body-composition data are 39.8% for women aged 20 and older, 40.5% for ages 40-59, and 42.4% for ages 60-79. A separate DXA reference dataset gives these age-group averages:
• Women aged 40-49: 39.2%.
• Women aged 50-59: 41.7%.
• Women aged 60-69: 42.4%.
These figures don’t conflict with the chart simply because one is “right” and another is “wrong.” An average calculated from a population answers a different question from a category range designed to classify results. The DXA figures describe a reference sample, while the chart’s 27% to 32% band is labeled average for women aged 40-49. Don’t treat either statistic as a personal ideal or a diagnosis.
That distinction matters because a population average can include women with varied body mass, muscle mass, and health profiles. A result above an average doesn’t by itself establish obesity or disease. In a 2025 study, body-fat-based criteria defined clinically relevant overweight as 36% or more for females and obesity as 42%. Those study cutoffs are specific definitions, not universal thresholds for every assessment.
Body-fat categories also differ from health-risk measures. The American Council on Exercise places 25% to 31% in its average category for women, while age-based reference ranges may extend beyond that band. A clinician interpreting a result considers the method, the person’s age, and other health indicators rather than relying on one cutoff. The same percentage can carry different meaning depending on the measurement method and the purpose of the comparison.
Use age-group averages to understand broad patterns, then compare like with like: the same method, similar measurement conditions, and the same age grouping. For example, a woman in her 50s can compare her result with the 50-59 DXA reference average of 41.7%, but should not read that average as a required goal. A trend across consistent measurements is more useful than chasing a population statistic.
When should women consult a healthcare professional about body fat measurements?
A body-fat result needs professional context when it raises a health question, conflicts with other measures, or changes alongside symptoms. A single percentage cannot diagnose a condition. For women over 40, age, measurement method, waist size, menstrual function, and bone health can all affect what the number means. Bring the result and the method used to a healthcare professional for a more complete assessment.
A BMI of 35 or above is a reason to speak with a healthcare professional rather than relying on waist measurement alone. Waist size is one indicator, not a complete assessment of body composition or health. A clinician can consider it alongside body-fat results, medical history, and other relevant measures. This matters when a waist-based estimate and a body-fat reading appear to point in different directions.
Very low body-fat levels also deserve attention. Extended periods below roughly 17% body fat can affect menstrual function. Very low body-fat levels may affect bone health, so low readings should be interpreted in context. These figures aren’t personal targets or diagnostic cutoffs, but they highlight why a low reading should be interpreted alongside menstrual and bone-health context.
Discuss your results if repeated measurements show a notable change, especially if it coincides with disrupted menstrual cycles or concerns about bone health. The method matters: waist equations, skinfold readings, smart scales, and DEXA assess body composition differently. A shift after changing methods may reflect the tool, not a rapid change in fat mass. Share previous readings and their dates to help identify a consistent trend.
Waist-to-height ratio can add context, but it isn’t a substitute for clinical assessment. A ratio of 0.6 or above is associated with the highest risk of health problems. For adults with a BMI of 35 or above, waist measurement alone isn’t the recommended basis for assessment. A professional can interpret both figures alongside other health indicators instead of relying on either number in isolation.
Choose a professional assessment when you need more than a general estimate. A DEXA scan measures body fat and its distribution, while a bone density scan addresses a separate question about bone health. These measurements can clarify different concerns, but they don’t replace a discussion of symptoms or medical history. Ask a healthcare professional to interpret relevant results together, particularly if a low body-fat reading accompanies menstrual changes or bone-health concerns.
If a more detailed body-composition measurement fits your goal, explore a DEXA body-composition scan as a next step.
Dexaslim
Dexaslim helps turn body-composition questions into measurable information. A 1 Session Dexa Scan measures body fat and shows how it is distributed, giving you a clearer baseline than BMI alone. For a broader view of metabolic health and performance, Dexaslim also offers VO2 Max Performance Testing, a Resting Metabolic Rate (RMR) Test, and a Longevity Panel.
Consider professional testing when home estimates leave you uncertain, you want a consistent baseline for tracking body composition, or your goals extend beyond weight. The right assessment depends on what you want to understand: body-fat distribution, aerobic performance, resting energy needs, or longevity markers. Contact Dexaslim to discuss which assessment fits your goals.
Turn Your Baseline Into a Clear Next Step
Use body-composition data to shape a plan around what you want to understand or change. The goal isn’t to chase a number in isolation, but to make decisions with a clearer view of your health priorities, performance, and the measures that matter to you. A focused conversation can connect those priorities to an appropriate assessment and help make the results useful in practice.
Calculating body fat percentage for women over 40 is most valuable when it supports a specific next step, whether that means establishing a baseline or adding context to your broader wellness goals. Choose the question you want answered, then use objective measurement to guide your next decision.
Contact Dexaslim to discuss your goals and identify a useful next step. Take action with clarity, and let better information support your progress.
Frequently Asked Questions
Does Your Age and Sex Affect Body Fat?
Yes, age and sex affect how body-fat results should be interpreted. Women typically have 6% to 11% more body fat than men, and women’s reference ranges also vary by age group. For example, a range cited for women aged 40-59 differs from one for women aged 60-79. Compare results with a reference suited to the person’s age and sex, rather than applying one cutoff to everyone.
Does menopause require a different chart?
Menopause doesn’t automatically require a separate chart, but age and body-fat distribution are relevant context. Use an age-appropriate reference range, then consider whether your body composition or fat distribution has shifted. Changes in weight alone, for instance, may not reveal changes in muscle and fat. A chart can frame the result, but it can’t account for every individual factor or replace interpretation alongside other health measures.
How Do Men and Women Differ in Body Fat?
Women typically carry 6% to 11% more body fat than men, and their essential-fat range is different. Essential fat supports basic functions, so the same percentage shouldn’t be interpreted identically across sexes. A useful comparison uses sex-specific categories rather than a shared target. For example, the American Council on Exercise lists women’s essential body fat at 10% to 13%, a range that isn’t a general fitness goal.
How often should I re-test body fat?
During an active change phase, retesting every 2-3 months can show whether a trend is developing; maintenance checks can be spaced to once a year. Keep the method and measurement conditions consistent. For example, comparing a smart-scale result with a DEXA result may reflect different methods, not a sudden body-composition shift. Record the measurement date and tool so each new reading has useful context.
Is 25 % body fat OK for a woman?
25% falls within the American Council on Exercise’s average category for women, which spans 25% to 31%. That classification doesn’t establish whether the result is right for a particular person. Age, measurement method, and health context matter. For example, a 25% reading from a circumference equation may differ from a DEXA result. Treat the category as a reference point, not a diagnosis or a required target.
What is the ideal body fat for each age?
There isn’t one ideal percentage for every age. A broad reference range is 23% to 33% for women aged 40-59 and 24% to 35% for women aged 60-79. These ranges describe reference groups, not personalized goals. Use the age band that fits, then consider the measurement method and relevant health context. A result at the same percentage can mean different things for different people.
How do professionals calculate body fat percentage for women over 40?
Professionals can estimate body fat with circumference equations or assess body composition with DEXA. A BMI-based equation for adult women is 1.20 × BMI + 0.23 × age − 5.4. It uses BMI and age to produce an estimate, not a direct measurement. DEXA provides a different assessment by measuring body fat and its distribution. The method chosen determines what the result can reveal.
What measurements do professionals use for the U.S. Navy body fat formula for women?
The U.S. Navy formula for women uses neck, natural waist, and hip circumferences, along with height. A professional measures the waist at its narrowest point and the hips at their largest horizontal circumference. Keep the waist relaxed during measurement. Enter these values into the formula to estimate body-fat percentage; they don’t directly measure fat tissue or show its distribution.