

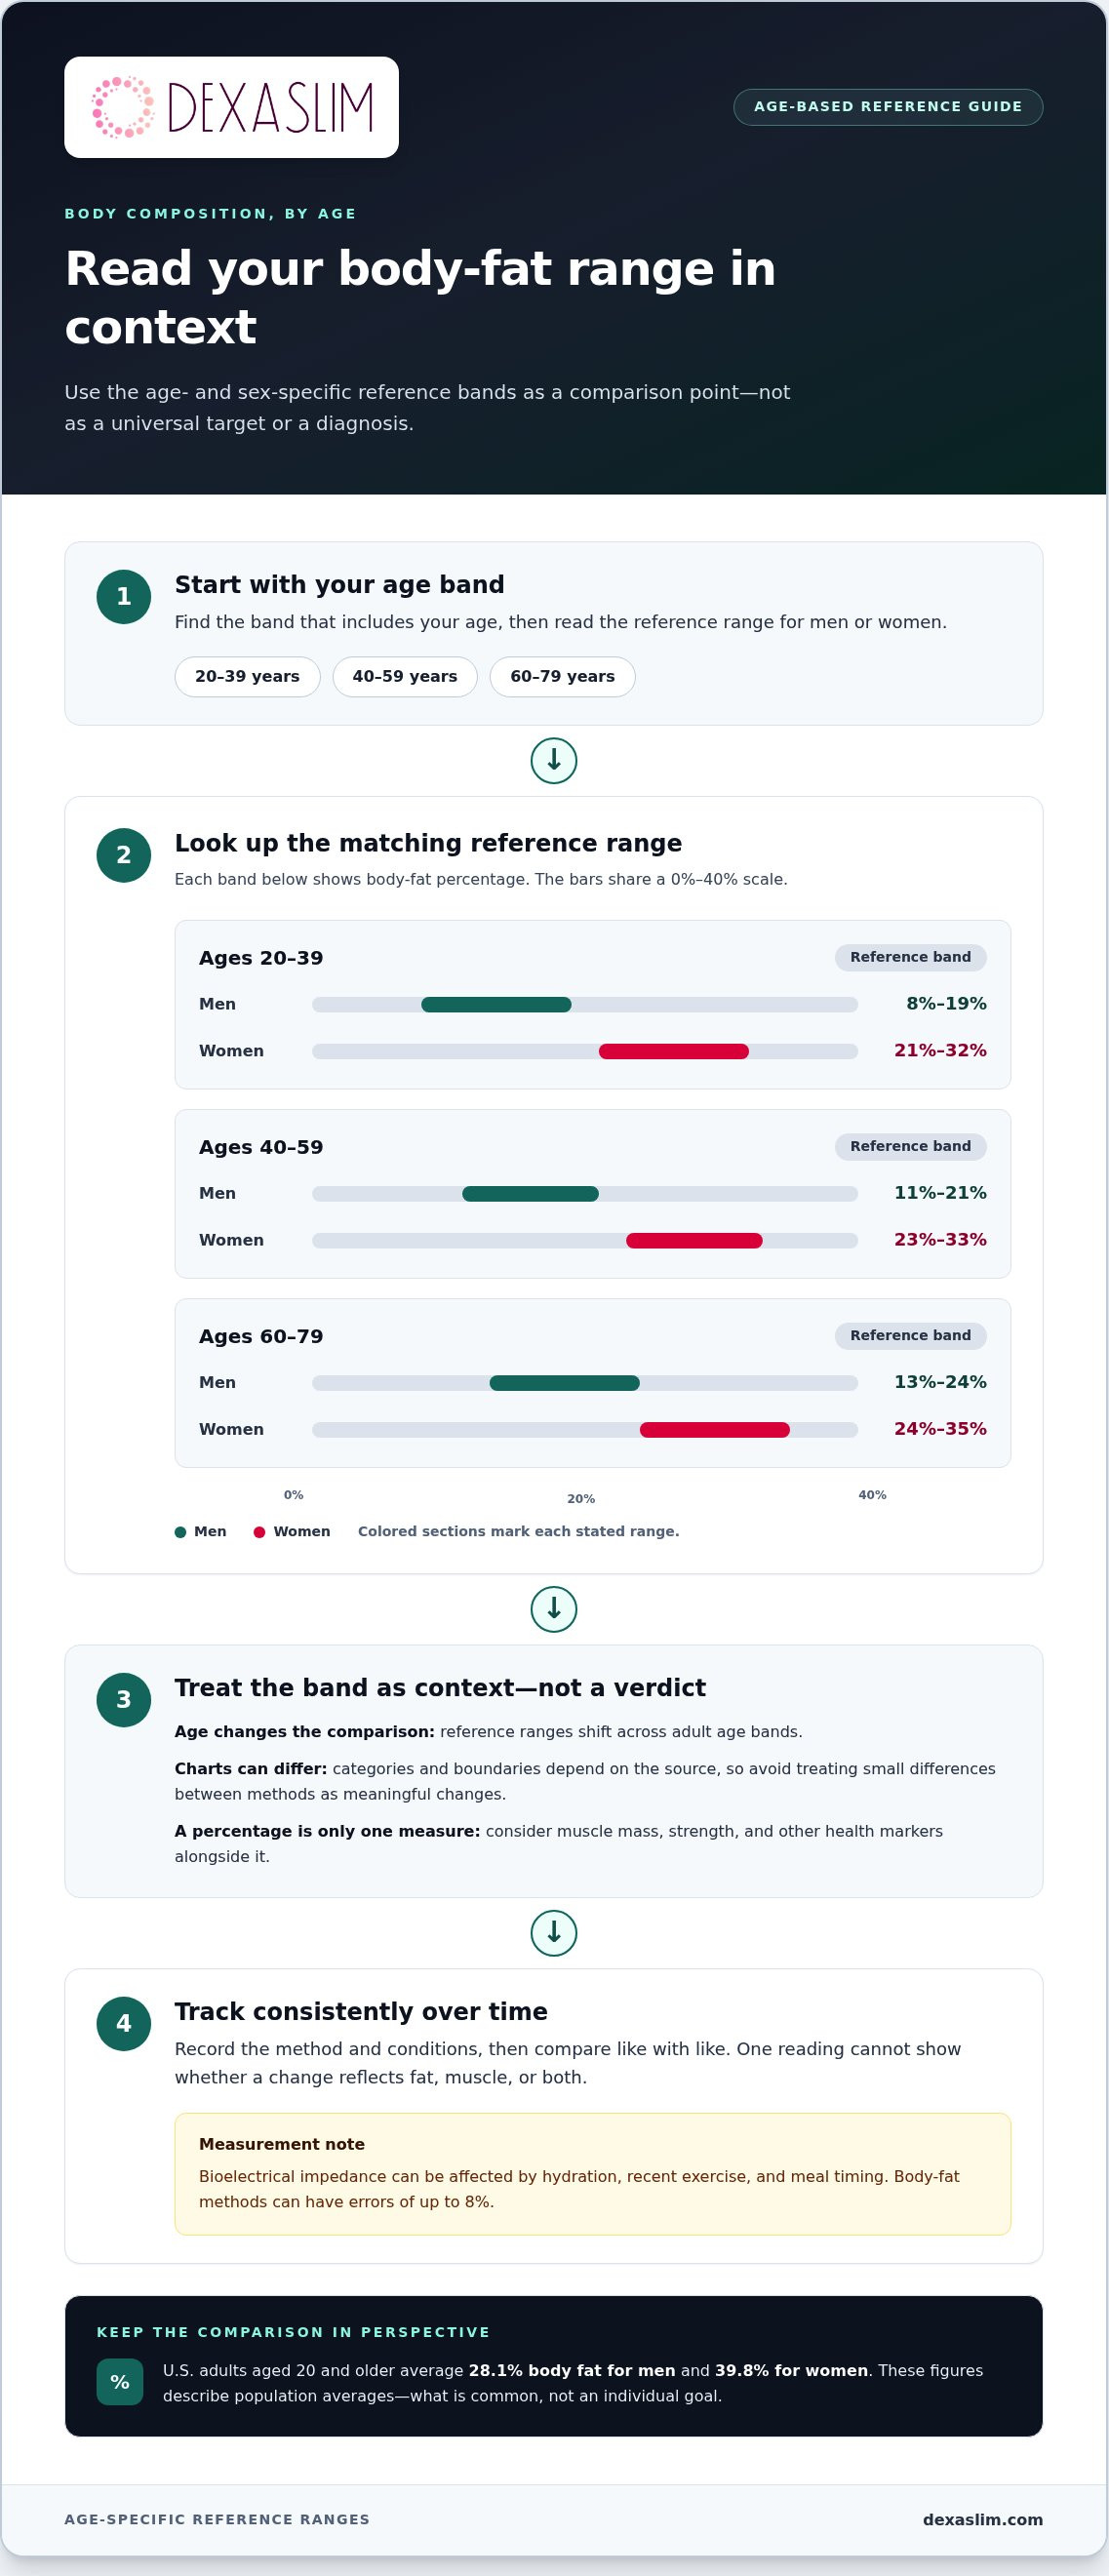
A body-fat percentage that’s healthy at one age may not be the right benchmark at another. If you’re asking, “what is a good body fat percentage for my age?” age and sex both matter: for adults aged 20 to 39, guideline-linked healthy ranges are 8% to 19% for men and 21% to 32% for women; for ages 60 to 79, they’re 13% to 24% for men and 24% to 35% for women. These ranges are useful reference points, not a single universal definition of normal.
It makes sense to want one clear number. But age-related changes in muscle and fat affect how a percentage compares over a lifetime, and measurement methods can produce different results. A single number never tells the whole story.
This guide explains age-based reference ranges for women and men, how body composition changes over time, and how population averages differ from healthy benchmarks. You’ll also learn why body-fat percentage is best considered alongside other measures and tracked consistently, making your result a useful baseline rather than a verdict.
Key Takeaways
• Use age- and sex-specific reference ranges as context, not as a universal target or a diagnosis.
• Population averages describe what’s common, not necessarily what’s right for your health or goals.
• Interpret body-fat percentage alongside muscle, strength, and other health markers for a more useful picture.
• Expect body composition to shift with age; track changes over time instead of judging progress from one reading.
• Compare measurement methods carefully, since factors such as hydration, recent exercise, and meal timing can affect some results.
What should my body fat percentage be?
There’s no agreed-upon normal body-fat range, so age, sex, muscle mass, and health markers matter. Too little can threaten basic functions: 10-13% body fat for women and 2-5% for men are described as barely enough for survival; excess fat, especially around the abdomen, is associated with higher health risks.
The video “What Body Fat Percentage Should You Aim For?” from Flow High Performance offers additional context for interpreting a target:
Population Averages and Individual Targets
A population average describes a group, while a healthy target considers personal body composition and health. U.S. adults aged 20 and older average 28.1% body fat for men and 39.8% for women. Those figures describe what’s common, not a goal each individual should pursue.
Use averages as context, then assess your own measurements alongside strength, muscle mass, and health markers. The American Council on Exercise lists an acceptable range of 18% to 24% for men. A 2025 study defined overweight at 25% body fat for men and 36% for women, and obesity at 30% for men and 42% for women. The different thresholds show why a category alone can’t establish an individual’s health.
Health Risks of Too Little or Too Much Fat
Very low body fat can leave too little stored energy to support essential functions, while excess fat can raise disease risk. For women, extended periods below roughly 17% body fat can affect menstrual function; 10-13% is described as barely enough to sustain basic survival functions.
For men, 2-5% is described as barely enough to survive. The American Council on Exercise categorizes 25% or higher as obesity for men and 32% or higher for women. A 2025 study uses different obesity thresholds, at 30% for men and 42% for women. These classifications aren’t interchangeable; consider the measurement method and broader health picture.
Location also matters. Abdominal fat is associated with metabolic risk, and waist circumference adds useful context: in the United States, 40 inches or more for men and 35 inches or more for women increases the risk of heart disease and type 2 diabetes. Pair that measure with body-fat percentage, rather than treating either one as a complete assessment.
Muscle and strength matter, too. Two people with the same estimated body-fat percentage may have different muscle mass and functional capacity. Track body composition over time using the same method; a single percentage can’t show whether a change reflects fat, muscle, or both.
Age-based body-fat reference ranges for women and men
Age-based ranges offer a reference point, not a personal diagnosis. Compare the range for your age and sex, then consider the measurement method and your overall health.
Women’s Ranges Across Age Groups
Guideline-linked reference ranges for women rise across adult age bands, offering a way to assess a result against peers. For ages 20 to 39, the range is 21% to 32%; for ages 40 to 59, it is 23% to 33%; and for ages 60 to 79, it is 24% to 35%.
These bands describe body-fat percentage, not body weight or height. Other charts use different labels and boundaries: the American Council on Exercise lists 25% to 31% as its average range for women, while its fitness category is 21% to 24%. Use one source consistently when tracking changes, and avoid treating a small difference between methods as a meaningful increase or decrease.
Men’s Ranges Across Age Groups
Men’s guideline-linked ranges also shift with age. The reference is 8% to 19% for ages 20 to 39, 11% to 21% for ages 40 to 59, and 13% to 24% for ages 60 to 79. Compare a result with the band that matches your age rather than using one number across adulthood.
Other reference charts divide age into narrower decades. One lists acceptable ranges of 14% to 24% for men ages 20 to 29, 15% to 25% for ages 30 to 39, and 18% to 28% for ages 60 and older. Differences between charts reflect distinct classification systems, so note the source and method before comparing results.
Athletic and General Ranges
Athletic categories describe lower body-fat ranges than general fitness categories, but they are not universal health targets. The American Council on Exercise classifies 14% to 20% as the athlete range for women and 6% to 13% for men. Its fitness ranges are 21% to 24% for women and 14% to 17% for men.
Use these categories for context, not as a reason to pursue an athletic percentage. Training, performance goals, and health markers all influence how to interpret a result. An athletic range does not mean someone is healthier than a person in a general range.
Typical Nonathlete Ranges
For nonathletes without strict physique requirements, reference ranges include 25% to 31% for women and 18% to 24% for men. These broad figures differ from age-specific bands because each chart has its own categories and purpose. Treat them as general comparisons, not precise individual targets.
Measurement method matters. Bioelectrical impedance can be affected by hydration, recent exercise, and meal timing; body-fat methods can have errors of up to 8%. Record the method, conditions, and result each time. Then compare like with like, rather than interpreting a single estimate without its source or measurement context.
Age-related changes in body composition
Yes. Adults aged 60 and older tend to have higher body-fat percentages than younger adults, and reference ranges shift with age. For ages 60 to 79, guideline-linked ranges are 13% to 24% for men and 24% to 35% for women. Use age-specific comparisons rather than treating a younger adult’s range as a lifelong target.
Talk with a doctor before changing weight or body-fat goals if a health condition, medication, or new symptom could affect your plan. A clinician can assess your medical history, strength, body composition, and other health markers alongside a percentage. This context matters more than chasing one number, especially if a measurement changes unexpectedly or affects daily function.
Age can shift the balance between fat and lean tissue. In cited U.S. DXA reference data, median body fat rose about 2% per decade from the twenties through the fifties in both sexes. Adults over 60 also tend to show higher percentages than younger adults. Body mass index cannot show how much of a person’s weight comes from fat versus muscle, so it offers a different view of composition.
Midlife can bring another transition for women. Menopause may change where fat is stored, while shifts in activity and muscle mass can also affect body composition. Men and women can both experience changes in lean tissue with age, but patterns vary from person to person. Track waist measurements, strength, and body-fat readings together, as each offers a different part of the picture.
For adults ages 50 to 70, interpret a result against the matching age band and examine function as well as percentage. Sustainable goals focus on gradual change, consistent exercise, and nutrition that supports muscle. Adults should do strength exercises for all major muscle groups at least 2 days per week. They should also aim for at least 150 minutes per week of moderate- to high-intensity aerobic exercise.
Build a repeatable plan instead of reacting to one reading. Reassess body-composition goals every 4-6 weeks, and record the measurement method, waist size, and strength progress. For example, stable weight with improved strength may reflect a different change than weight loss alone. Pairing these measures helps make progress more accurate and keeps the goal focused on function, not just a percentage.
Age-specific body fat percentage categories for people assigned female at birth
Body-fat charts classify percentages by age, sex, and purpose. The American Council on Exercise (ACE) categories offer one framework, while age-based charts include narrower “good” and “excellent” bands.
For people assigned female at birth, the chart’s age-specific “good” ranges rise across the decades shown. The corresponding ranges for people assigned male at birth also change with age. Use the table as a reference, not as a standalone measure of health or weight.
Women, ages 20-29
“Excellent” is 14% to 16.5%; “good” is 16.6% to 19.4%.
Women, ages 30-39
“Excellent” is 14% to 17.4%; “good” is 17.5% to 20.8%.
Women, ages 40-49
“Excellent” is 14% to 19.8%; “good” is 19.9% to 23.8%.
Women, ages 50-59
“Excellent” is 14% to 22.5%; “good” is 22.6% to 27%.
Women, ages 60-69
“Excellent” is 14% to 23.2%; “good” is 23.3% to 27.9%.
Men, ages 20-29
“Excellent” is 8% to 10.5%; “good” is 10.6% to 14.8%.
Men, ages 30-39
“Excellent” is 8% to 14.5%; “good” is 14.6% to 18.2%.
For men, the age-based chart also gives “good” ranges of 17.5% to 20.6% at ages 40-49, 19.2% to 22.1% at ages 50-59, and 19.8% to 22.6% at ages 60-69. These labels belong to that chart’s classification system; don’t assume they match another source’s categories.
ACE defines essential body fat as 10% to 13% for women and 2% to 5% for men. Its athlete categories are 14% to 20% for women and 6% to 13% for men. The fitness category is 21% to 24% for women and 14% to 17% for men. ACE’s obese category starts at 32% for women and 25% for men.
These categories are not interchangeable with overweight classifications or a direct diagnosis of disease. A 2025 study defined overweight at 36% body fat for women and 25% for men, and obesity at 42% for women and 30% for men. Those thresholds differ from ACE’s categories, so identify the source before interpreting a body-fat measurement result. Nutrition, activity, and overall health also shape what a percentage means for individual adults.
Average body fat percentages by age
Population averages show how body-fat levels compare across age groups, not what each person should target. U.S. adults ages 20 and older average 28.1% for men and 39.8% for women. The age breakdown adds context, but an average cannot diagnose health or set an individual goal.
Among adults ages 20 to 39, average body fat is 26.1% for men and 37.8% for women. For ages 40 to 59, averages are 28.6% for men and 40.5% for women. Men ages 60 to 79 average 30.8%. These figures show how group averages can increase with age, but they don’t describe every person within a group.
DXA reference data gives another view by decade. Mean body fat for men was 21.1% at ages 20-29 and 29.1% at ages 40-49. For women, the mean was 31.4% at ages 20-29, 39.2% at ages 40-49, and 42.4% at ages 60-69. The values come from a reference sample of 3,327 whole-body scans across two university exercise physiology laboratories. That sample was 95% white, which limits how broadly its averages represent the U.S. population.
Percentiles show why age matters. In one DXA example, a 25-year-old man with 25% body fat ranked around the 30th percentile among men his age. At the same 25%, a 65-year-old man ranked around the 80th percentile. The percentage is identical, but its position relative to same-age peers differs. A percentile describes comparison, not whether a result is medically healthy.
Measurement methods also affect comparisons. Bioelectrical impedance estimates body fat and can be affected by hydration, recent exercise, and meal timing. Methods can have errors of up to 8%. Skinfold calipers estimate fat from measurements under the skin, while a calculator using height and weight produces BMI, not body-fat percentage. To compare results, record the method and use the same one each time.
Use averages as a population reference, then assess your own result against age- and sex-specific ranges, muscle, waist measurements, and health markers. The U.S. national survey used to calculate body-fat-based overweight and obesity included adults ages 18 to 85. Its broad age coverage helps describe population patterns, but the mean still isn’t an individual target. Track measurements over time, and interpret changes with the method and context in view.
Dexaslim: 1 Session Dexa Scan
Dexaslim’s 1 Session Dexa Scan gives you a measured view of body composition when age-based charts don’t show how your body is changing. Medical-grade DEXA technology assesses body composition and bone density, adding detail beyond a population average or scale reading. Use the scan as a baseline when you want to understand changes in fat and lean tissue, or to track progress over time.
Combining an objective measurement with strength, waist size, and health markers can help focus your next steps. A scan can track body composition, but it does not replace medical advice or assess health risks on its own.
Contact Dexaslim to learn more about the 1 Session Dexa Scan.
Turn Your Measurement Into a Clear Next Step
The question “what is a good body fat percentage for my age?” can help guide your next decision, but it doesn’t define your potential. Use your result to clarify what you want to understand or improve, then choose measurements that suit that goal. A clear baseline makes future progress easier to interpret and gives you a more focused starting point.
Dexaslim offers a 1 Session Dexa Scan for body-composition measurement, plus VO2 Max Performance Testing and a Resting Metabolic Rate (RMR) Test. Each provides a different data point, helping you build a broader picture instead of relying on one number. Choose the assessment that aligns with the question you want to answer.
Contact Dexaslim for support and take your next step with greater clarity. Consistent, objective tracking can help you refine your approach over time. Let your data inform the plan, and keep moving toward stronger, more informed health decisions.
Frequently Asked Questions
What's Ideal?
There isn’t one ideal body-fat percentage for every adult. Age, sex, muscle mass, measurement method, and health markers all affect how to interpret a result. To answer “what is a good body fat percentage for my age,” start with the relevant age and sex reference, then consider your strength and health context. Treat a chart as a comparison tool, not a personal diagnosis or a target you must reach.
What's the Best Way to Measure Your Body Fat?
Choose a method that measures body composition directly, and use it consistently for comparisons. A DEXA scan assesses body fat, lean tissue, and bone density. Bioelectrical impedance scales estimate body composition, but hydration, recent exercise, and meal timing can affect their readings. Skinfold calipers measure folds beneath the skin. Whichever method you use, record the method and conditions to make changes over time easier to interpret.
Why Is Body Composition Important?
Body composition separates fat mass from lean tissue, revealing changes that body weight alone can hide. For example, weight may stay similar while muscle increases and fat decreases. That distinction can help you assess whether a nutrition or exercise plan is producing the change you want. Consider body composition alongside strength, waist measurement, and relevant health markers, rather than treating one measurement as a complete picture.
What are healthy body fat percentage ranges by age for men?
Guideline-linked ranges for men are 8% to 19% at ages 20 to 39, 11% to 21% at ages 40 to 59, and 13% to 24% at ages 60 to 79. Other charts use different age bands and classifications. For instance, the American Council on Exercise lists 14% to 24% as an acceptable range for men. Compare your result using one chart consistently.
What are healthy body fat percentage ranges by age for women?
Guideline-linked ranges for women are 21% to 32% at ages 20 to 39, 23% to 33% at ages 40 to 59, and 24% to 35% at ages 60 to 79. A different chart may label ranges as acceptable, good, or average, with different boundaries. Note the chart’s age band and classification before comparing your number, and interpret it alongside strength and other health indicators.
How do body fat recommendations change with age?
Reference ranges generally shift upward across adult age bands, reflecting changes in body composition over time. In cited DXA data, median body fat rose about 2% per decade from the twenties through the fifties in both sexes. That trend doesn’t predict an individual’s result. Compare measurements within the same age-specific framework, and track muscle, strength, and waist changes alongside body-fat percentage.
What body fat percentage is considered essential, athletic, average, or high?
Under American Council on Exercise categories, essential fat is 10% to 13% for women and 2% to 5% for men. Athlete ranges are 14% to 20% for women and 6% to 13% for men; fitness ranges are 21% to 24% and 14% to 17%, respectively. ACE’s obesity category starts at 32% for women and 25% for men. These are classifications, not individual diagnoses.
How do pregnancy, menopause, or hormonal changes affect healthy body fat ranges?
Pregnancy changes body weight and composition, so a pre-pregnancy body-fat chart cannot describe those changes on its own. Menopause and other hormonal shifts can also affect fat distribution and lean mass. Interpret measurements in context instead of applying a standard adult range mechanically. If you’re setting goals during pregnancy, after pregnancy, or during hormone-related changes, discuss your plan with a healthcare professional who understands your situation.