

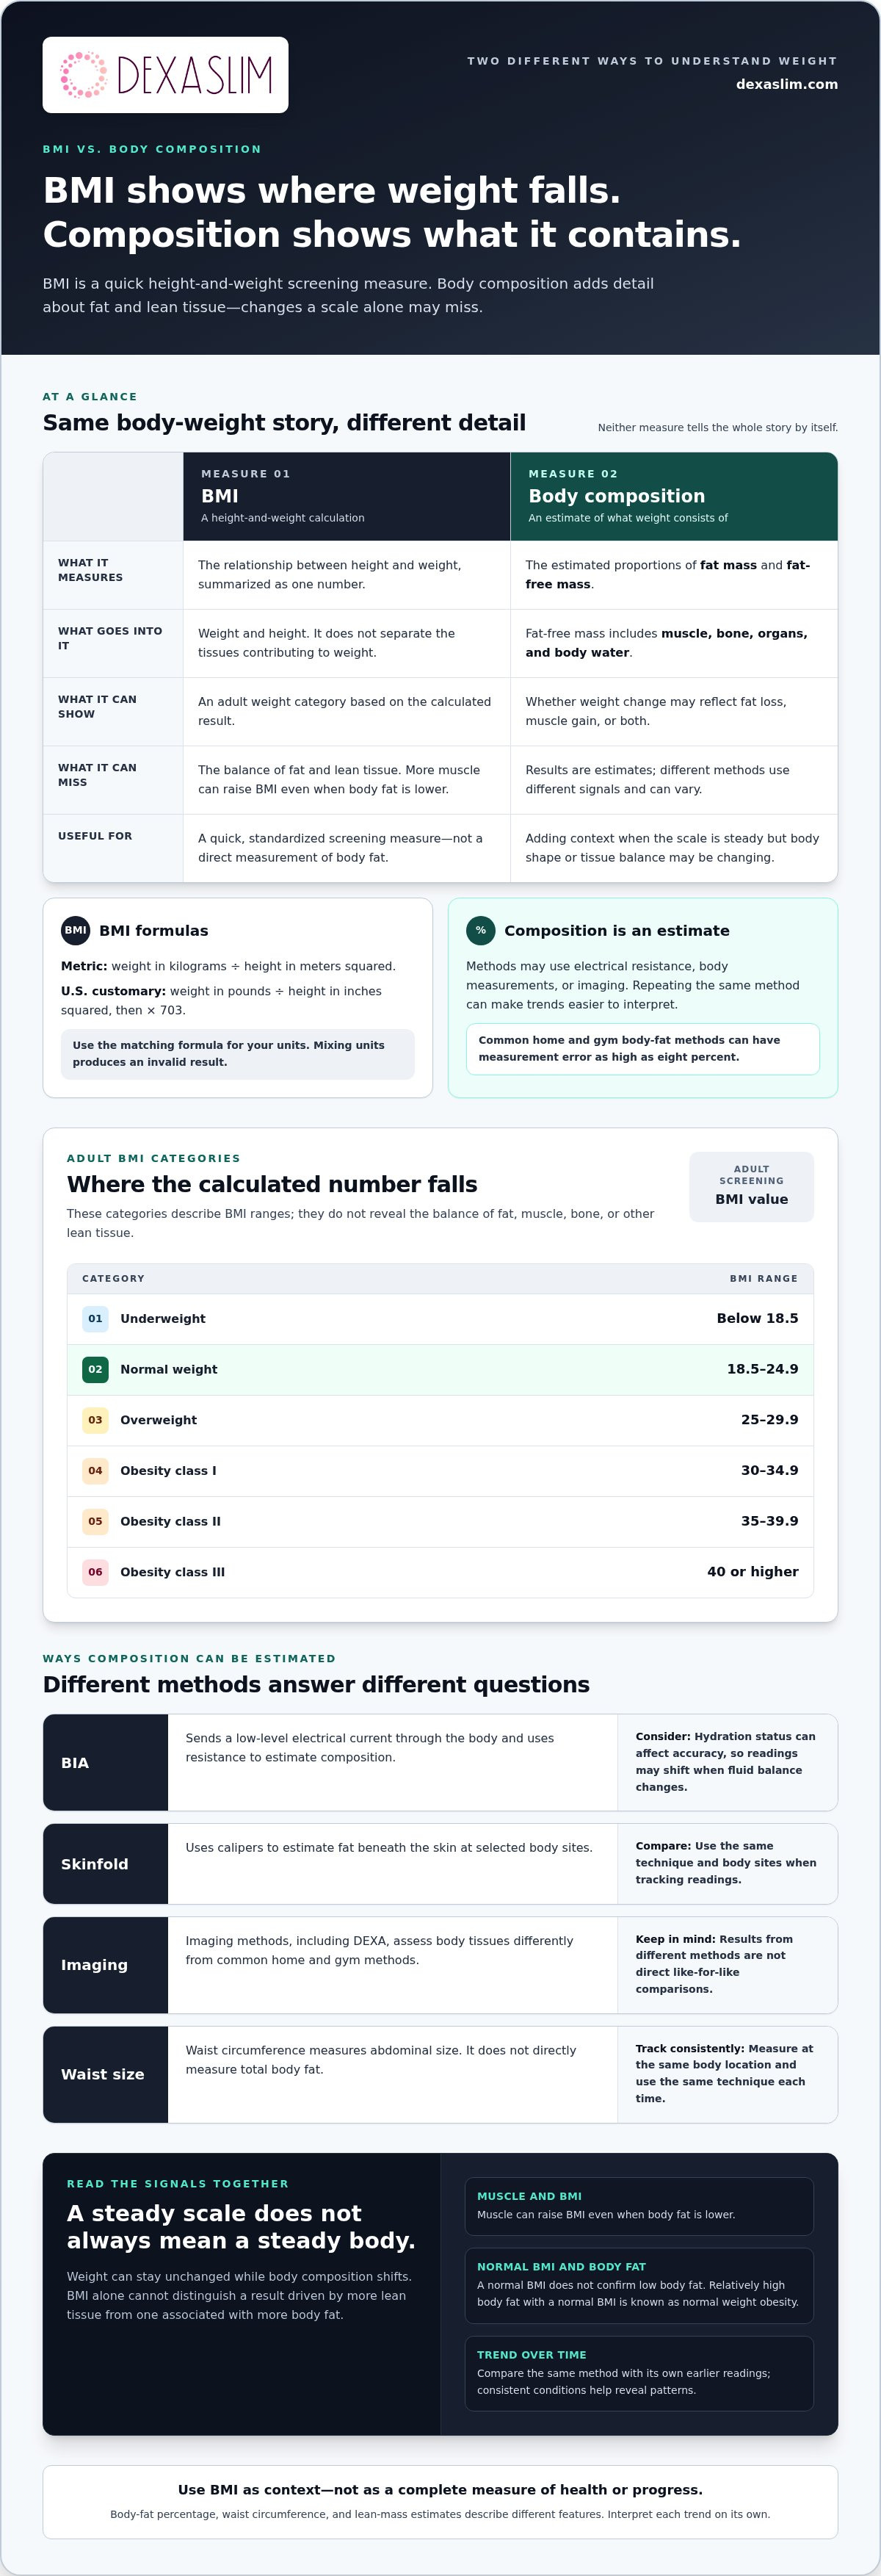
BMI can look high even when much of your weight comes from muscle. In the comparison of body composition vs BMI, BMI is a height-and-weight calculation: weight in kilograms divided by height in meters squared, or weight in pounds divided by height in inches squared and multiplied by 703. Body composition looks at what that weight consists of, including fat and lean tissue.
Both measures describe aspects of your body, but they answer different questions. BMI is a quick screening measure; body composition adds detail about changes a scale alone can miss. Neither tells the whole story by itself.
Learn how each measure works, how muscle and fat affect BMI differently, and what to consider when your weight stays steady but your body changes. This guide explains what body composition can show, where BMI is useful, and how to interpret them together for a clearer picture of weight and fitness.
Key Takeaways
• BMI uses height and weight to classify weight, but it doesn’t show how much of your weight comes from fat or lean tissue.
• Body composition measurements add detail about the makeup of your body, helping explain changes a scale may miss.
• Muscle can raise BMI even when body fat is lower, so the number may not reflect your full fitness picture.
• Track body-composition changes consistently over time to see patterns that a single weight reading can’t reveal.
• Use BMI as one piece of context, not a complete measure of health or progress.
BMI formulas and weight classifications
BMI uses height and weight to produce a screening number, then places adults into categories. The formula is straightforward, but it doesn’t show what makes up a person’s weight.
Calculating BMI
BMI is calculated by dividing weight by height squared, using either metric or U.S. customary measurements. For kilograms and meters, divide weight in kilograms by height in meters squared. For pounds and inches, divide weight in pounds by height in inches squared, then multiply by 703. Use the matching formula for your units; mixing them produces an invalid result. The calculation matters because a consistent formula gives you a standardized screening measure, not a direct measurement of body fat.
Weight Categories Based on BMI
Adult BMI categories group results into underweight, normal weight, overweight, and obesity ranges. According to the Centers for Disease Control and Prevention, a BMI below 18.5 is classified as underweight. A BMI from 18.5 to 24.9 is normal weight, while the Centers for Disease Control and Prevention classifies 25-29.9 as overweight. These ranges help interpret a result in context, but they don’t explain body composition.
The obesity categories add detail at higher BMI values. According to the Centers for Disease Control and Prevention, 30-34.9 is obesity class I, and 40 or higher is obesity class III. A BMI from 35 to 39.9 is obesity class II. These labels describe where a calculated value falls. They don’t establish how much of a person’s weight comes from fat, muscle, bone, or other lean tissue.
That distinction matters for normal weight obesity. Some people may have a normal BMI despite having a relatively high body-fat percentage, a pattern known as normal weight obesity. BMI alone can therefore appear ordinary even when body-fat levels tell a different story. Consider both the BMI category and the balance of fat and lean tissue when interpreting what weight may mean.
Use BMI as a starting point, not a complete body assessment. It can indicate an adult weight category, but it can’t distinguish a higher result driven by muscle from one associated with more body fat. Likewise, a result in the normal range doesn’t confirm that body fat is low. Add a body-composition measure when you want to understand what your weight consists of, not just where it falls on a chart.
What Is Body Composition?
Body composition describes the tissues and components that contribute to body weight. The body composition vs BMI comparison matters because composition offers detail about what weight consists of, while BMI doesn’t separate those components.
What Body Composition Measures
Body composition estimates the proportions of fat mass and fat-free mass in your body. Fat-free mass includes muscle, bone, organs, and body water. These components help explain why two people at the same weight can have different physiques. They also help track whether weight change reflects fat loss, muscle gain, or both.
A body-composition result is an estimate, not a direct inventory of every tissue. Methods use different signals, such as electrical resistance, body measurements, or imaging. The body composition vs BMI distinction is useful when you want to understand what a weight reading can’t show. Repeating measurements with the same method can reveal trends more clearly than comparing results from different devices.
Body Fat Measurement Methods
Body-fat measurement methods estimate fat mass or body-fat percentage in different ways. Bioelectrical impedance analysis, or BIA, sends a low-level electrical current through the body and uses resistance to estimate composition. Hydration status can affect BIA accuracy, so readings may shift when fluid balance changes.
Skinfold calipers estimate fat beneath the skin at selected body sites. Imaging methods, including DEXA, assess body tissues differently. Common home and gym body-fat methods can have measurement error as high as eight percent. Treat a single reading as an estimate, and focus on whether repeated readings show a consistent direction.
Waist circumference provides a practical measure of abdominal size. It doesn’t directly measure total body fat, but it can help estimate central fat accumulation associated with higher risk for metabolic conditions. Measure at the same body location and use the same technique each time. A changing waist measurement alongside steady scale weight can add useful context.
Choose a method based on the question you want answered. For broad tracking, repeated measurements with a familiar method can be more useful than switching devices to pursue a more advanced option. Keep conditions consistent, including the device, technique, and timing relative to hydration. If you record circumference and a body-fat estimate, keep them separate so you can interpret each trend clearly.
Use the result as one piece of information, not a complete health assessment. Body-fat percentage, waist circumference, and lean-mass estimates describe different features. Compare like with like: BIA readings with earlier BIA readings, or a circumference measurement with its own baseline. Consistent comparisons make the data easier to interpret and help distinguish measurement variation from a meaningful trend.
Limitations of BMI for people with different muscle and fat levels
BMI compresses body weight and height into one value, but it can’t identify the tissues contributing to that weight. The body composition vs BMI distinction matters when muscle, fat, and fitness change at different rates.
Two people with the same height and weight can have different amounts of muscle and body fat. A strength-trained person may have more lean tissue, while another person’s weight may include a higher proportion of fat. BMI produces the same result for both because it doesn’t measure tissue makeup. It describes their height-to-weight relationship, not what accounts for it.
This limits BMI as a fitness measure. It doesn’t assess strength, endurance, training capacity, or how your body responds to exercise. You may get stronger or perform better while your BMI stays steady. Conversely, a changed BMI can’t reveal whether weight shifted through fat, muscle, or another component. Pair BMI with a relevant performance measure when assessing fitness progress.
Body-fat estimates also have limitations. Bioelectrical impedance analysis, or BIA, estimates composition from electrical resistance, and hydration status can affect its accuracy. A result taken when fluid balance differs may not be directly comparable with another reading. The method can still be useful, but consistent measurement conditions matter when tracking change.
Other methods use different inputs. Skinfold measurements depend on consistent placement and technique, while waist circumference tracks abdominal size rather than total body-fat percentage. Common home and gym body-fat methods can have measurement error as high as eight percent. These measurements answer different questions, so don’t treat them as interchangeable or assume every small change is real.
For a useful comparison, keep the method consistent. Compare BIA results with earlier BIA results, and repeat circumference measurements at the same location using the same technique. The body composition vs BMI comparison is clearer when you interpret each measure according to what it assesses, rather than expecting BMI to serve as a body-fat test.
People who work out regularly are advised to have their body-fat percentage calculated periodically for a more accurate picture of health and fitness. Consider that estimate alongside training performance and strength changes. A consistent record can show whether those indicators move together or tell different stories. Use BMI as a broad height-and-weight reference, then add measures that address your specific question.
Muscle gain and fat loss despite unchanged weight
Body composition describes the balance of fat and lean tissue; BMI compares weight with height. The difference matters because these measures can tell different stories about the same person’s progress.
Body Composition Changes at the Same Weight
Body composition can shift while scale weight stays stable because fat and muscle contribute to the same total. A person can lose 5 pounds of body fat and gain 5 pounds of muscle, leaving weight and BMI unchanged. That distinction matters during training: a steady scale reading may hide a meaningful change in the body’s tissue balance.
Consider the 16-week strength-training example: two clients each weigh 180 pounds before and after the program. Their unchanged weight doesn’t establish that their bodies changed in the same way. Different amounts of fat and lean muscle can produce identical weights, so the scale alone cannot show what changed during training.
BMI Cannot Distinguish Fat from Muscle
BMI uses height and weight, so it cannot separate muscle mass from fat mass. Two people who each weigh 180 pounds can have the same BMI despite different body-fat percentages and amounts of lean muscle. This limitation matters most when assessing progress through resistance training, where body composition can change without a corresponding shift in the BMI result.
Track more than one indicator. Pair scale weight with a consistent body-composition measure and records of strength or training performance. If your weight stays steady while strength improves, the added context helps explain what the scale can’t identify. Don’t treat BMI as a direct measurement of fat or muscle.
Visceral Fat and Lean Muscle Health Effects
Visceral fat is stored around the abdomen’s internal organs, while lean muscle supports movement and physical function. Waist circumference can help estimate central fat accumulation associated with higher risk for metabolic conditions. Fat distribution therefore matters alongside total weight, since BMI doesn’t show where fat is carried.
Muscle is another distinct part of body composition. Strength training provides a way to challenge and maintain it; the guidance here is at least two to three strength-training sessions per week. Interpret your training alongside changes in body composition, rather than relying on BMI alone to judge how your body is responding.
Build a clearer picture of progress by consistently recording weight, strength, and body-composition measurements. Compare like with like over time, and note whether performance changes while weight remains steady. For example, stable weight combined with rising strength and a shifting body-composition result offers more information than BMI alone. Consider these signals together without assuming a single measurement explains every change.
Adult BMI categories
Adult BMI categories place a calculated result into a reference range. Each range gives a standardized label, but it doesn’t describe body fat, muscle, or fat distribution. Read the category as one piece of information about weight, not a complete profile of health or fitness.
The Centers for Disease Control and Prevention classifies a BMI from 25 to 29.9 as overweight. For adults, a BMI of 30 or greater is classified as obese in the ranges listed by the Centers for Disease Control and Prevention. The higher range is divided into classes, which give more detail about where a result falls.
Underweight
BMI below 18.5.
Normal weight
BMI from 18.5 to 24.9.
Overweight
BMI from 25 to 29.9.
Obesity class I
BMI from 30 to 34.9.
Obesity class II
BMI from 35 to 39.9.
Obesity class III
BMI of 40 or higher.
These boundaries make it easier to interpret a result consistently. For example, a BMI of 24.9 falls in the normal-weight range, while 25 falls in the overweight range. A result of 30 enters obesity class I, and 40 reaches obesity class III. The category changes at the listed cutoffs, even when two results are numerically close.
That boundary shift doesn’t mean a person’s body changes abruptly at the cutoff. The label changes because the number crossed a classification threshold. A reading near 25 or 30 should therefore be understood alongside the person’s body composition and other relevant health information, rather than treated as a sudden change in physical condition.
BMI categories don’t explain why a result falls within a particular range. Since BMI reflects height and weight, it can’t show whether muscle contributes substantially to total weight or where body fat is stored. Two adults with the same BMI may have different proportions of fat and lean tissue. The category is a shared reference point, not an individual body-composition reading.
Use the range to frame a conversation about weight, then consider what additional information could clarify the result. If strength training changes your muscle mass, for example, your BMI category may not reflect the full change in your body. Pairing the category with a consistent body-composition measure can add context, especially when your weight or training patterns shift. For adults, the practical value is reading the classification accurately without treating it as a complete assessment.
Dexaslim: 1 Session Dexa Scan
Dexaslim’s 1 Session Dexa Scan offers a direct next step when BMI leaves questions about fat and lean tissue unanswered. Using medical-grade DEXA technology, the scan assesses body composition and bone density, adding measurable detail to weight and height-based screening. It can help you establish a clearer baseline or understand changes that a steady scale reading may not show.
For a broader view, Dexaslim also offers VO2 Max Performance Testing, a Resting Metabolic Rate (RMR) Test, and a Longevity Panel. These options address different questions, from aerobic performance to resting energy needs and longevity markers.
Contact Dexaslim to explore whether a 1 Session Dexa Scan fits your goals.
Turn Your Measurements Into a Clearer Plan
Choose your next step based on the question you need answered. If you’re tracking training progress, focus on changes that reveal more than body weight alone. If you’re reviewing weight-related health, use measurements as context for a broader discussion, not as a verdict on your potential.
The value of body composition vs BMI lies in choosing the right measure for the decision in front of you. A useful baseline helps you assess change, refine your approach, and identify what information could make your next step more precise. Keep your goal specific, and use consistent measurements to track progress over time.
Dexaslim offers measurement and performance testing options that can support a more detailed personal baseline. Contact Dexaslim to discuss your goals and identify a useful next step. Build your plan around better data, then keep moving forward with purpose.
Frequently Asked Questions
Can BMI be wrong for muscular people?
Yes, BMI can give a misleading impression for someone with substantial muscle mass. The calculation reflects height and weight, but it can’t distinguish muscle from fat. A strength-trained person may fall into a higher BMI category despite having a different body composition from someone at the same height and weight. Treat the category as a screening signal, then add a measure that assesses body composition.
Should I stop using BMI entirely?
No. BMI can remain useful as a quick, consistent screening measure, especially for tracking broad changes over time. The key is not to treat it as a complete description of your body or fitness. For example, if your BMI stays steady while your training and strength change, add body-composition data and performance records. Use each measure for what it can show, rather than expecting one number to answer every question.
What is BMI?
BMI, or body mass index, relates a person’s weight to their height through a calculation. It produces a standardized number that can be placed into adult weight categories. BMI does not directly measure body fat, muscle, or fitness. This distinction matters when interpreting an individual result: the number describes a weight range, but can’t explain the physical makeup behind that weight.
Which Method is Best?
The best method depends on what you want to understand. Use BMI for a quick height-and-weight screening measure; choose a body-composition method when you want an estimate of fat and lean tissue. Waist circumference can add information about central fat accumulation, while a body-fat estimate answers a different question. For progress tracking, keep the method consistent so changes in approach don’t muddy comparisons.
Why does my BMI stay the same when I am getting fitter?
Your BMI can remain unchanged if your weight and height stay similar, even as your fitness improves. Training, for example, may change the balance of fat and lean tissue without changing total weight. BMI doesn’t measure workout performance or strength. Track those outcomes separately, and use a consistent body-composition measure to see whether changes in fat and lean tissue accompany improved fitness.
How is BMI calculated, and what are the standard BMI categories for adults?
BMI is weight in kilograms divided by height in meters squared; in U.S. units, divide pounds by inches squared and multiply by 703. Adult categories are underweight below 18.5, normal weight from 18.5 to 24.9, overweight from 25-29.9, obesity class I from 30-34.9, class II from 35-39.9, and class III at 40 or higher. The Centers for Disease Control and Prevention classifies 25-29.9 as overweight and 30 or greater as obese.
What does body composition measure, including body fat, muscle, bone, and water?
Body composition estimates the proportions of tissues and components that make up body weight. These include body fat, muscle, bone, and water, as well as other fat-free tissues such as organs. Measurement methods estimate these components using different signals or techniques, so results aren’t a direct inventory. Consider what each measure reports and use the same method when comparing readings over time.
How do BMI and body fat percentage compare in accuracy for assessing health?
Neither measure provides a complete health assessment, and what is “more accurate” depends on the question. BMI offers a standardized height-and-weight calculation, while body-fat percentage estimates the proportion of weight that is fat. That estimate depends on the measurement method, and hydration can influence bioelectrical impedance readings. Use BMI for category context and body-fat percentage for composition detail, then interpret both alongside relevant individual health information.