
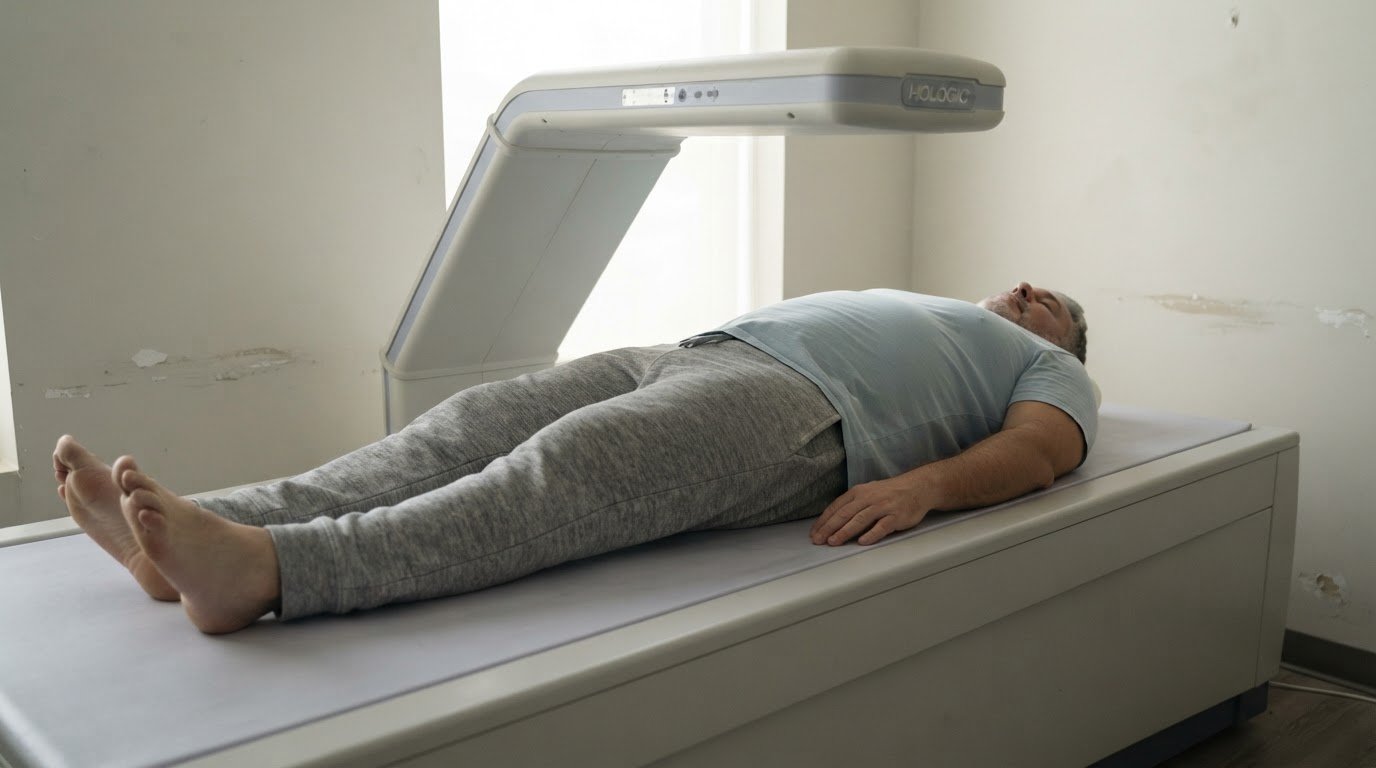
A “good” DEXA ratio isn’t one universal number. A ratio below 0.8 is considered ideal for women, and below 1.0 for men, according to UC Davis Health. For android vs gynoid fat distribution, DEXA shows whether fat is relatively more concentrated around the abdomen or the hips and thighs.
Body weight alone can’t show where fat is stored. The android-to-gynoid ratio adds context by comparing fat in the abdominal and hip-and-thigh regions, but it does not diagnose a health condition. A higher ratio indicates relatively more fat in the android region; interpretation depends on factors such as sex and how the scan defines each region.
This article explains how DEXA defines android and gynoid fat, how to interpret the ratio, and why central fat distribution matters when considering cardiometabolic health. It also clarifies how the ratio differs from visceral-fat measurements and why it should be considered alongside other body-composition results.
Key Takeaways
• Read the ratio as a comparison of fat in the abdominal and hip-and-thigh regions, not as a diagnosis.
• Common reference points differ by sex: below 0.8 for women and below 1.0 for men are described as ideal.
• A waist measurement and a DEXA ratio offer different information, so one can't replace the other.
• Separate regional fat distribution from visceral fat, which is stored deeper in the abdomen around internal organs.
• Interpret the number alongside scan method and other health measures to understand what it may mean for cardiometabolic risk.
What is a good android-to-gynoid ratio?
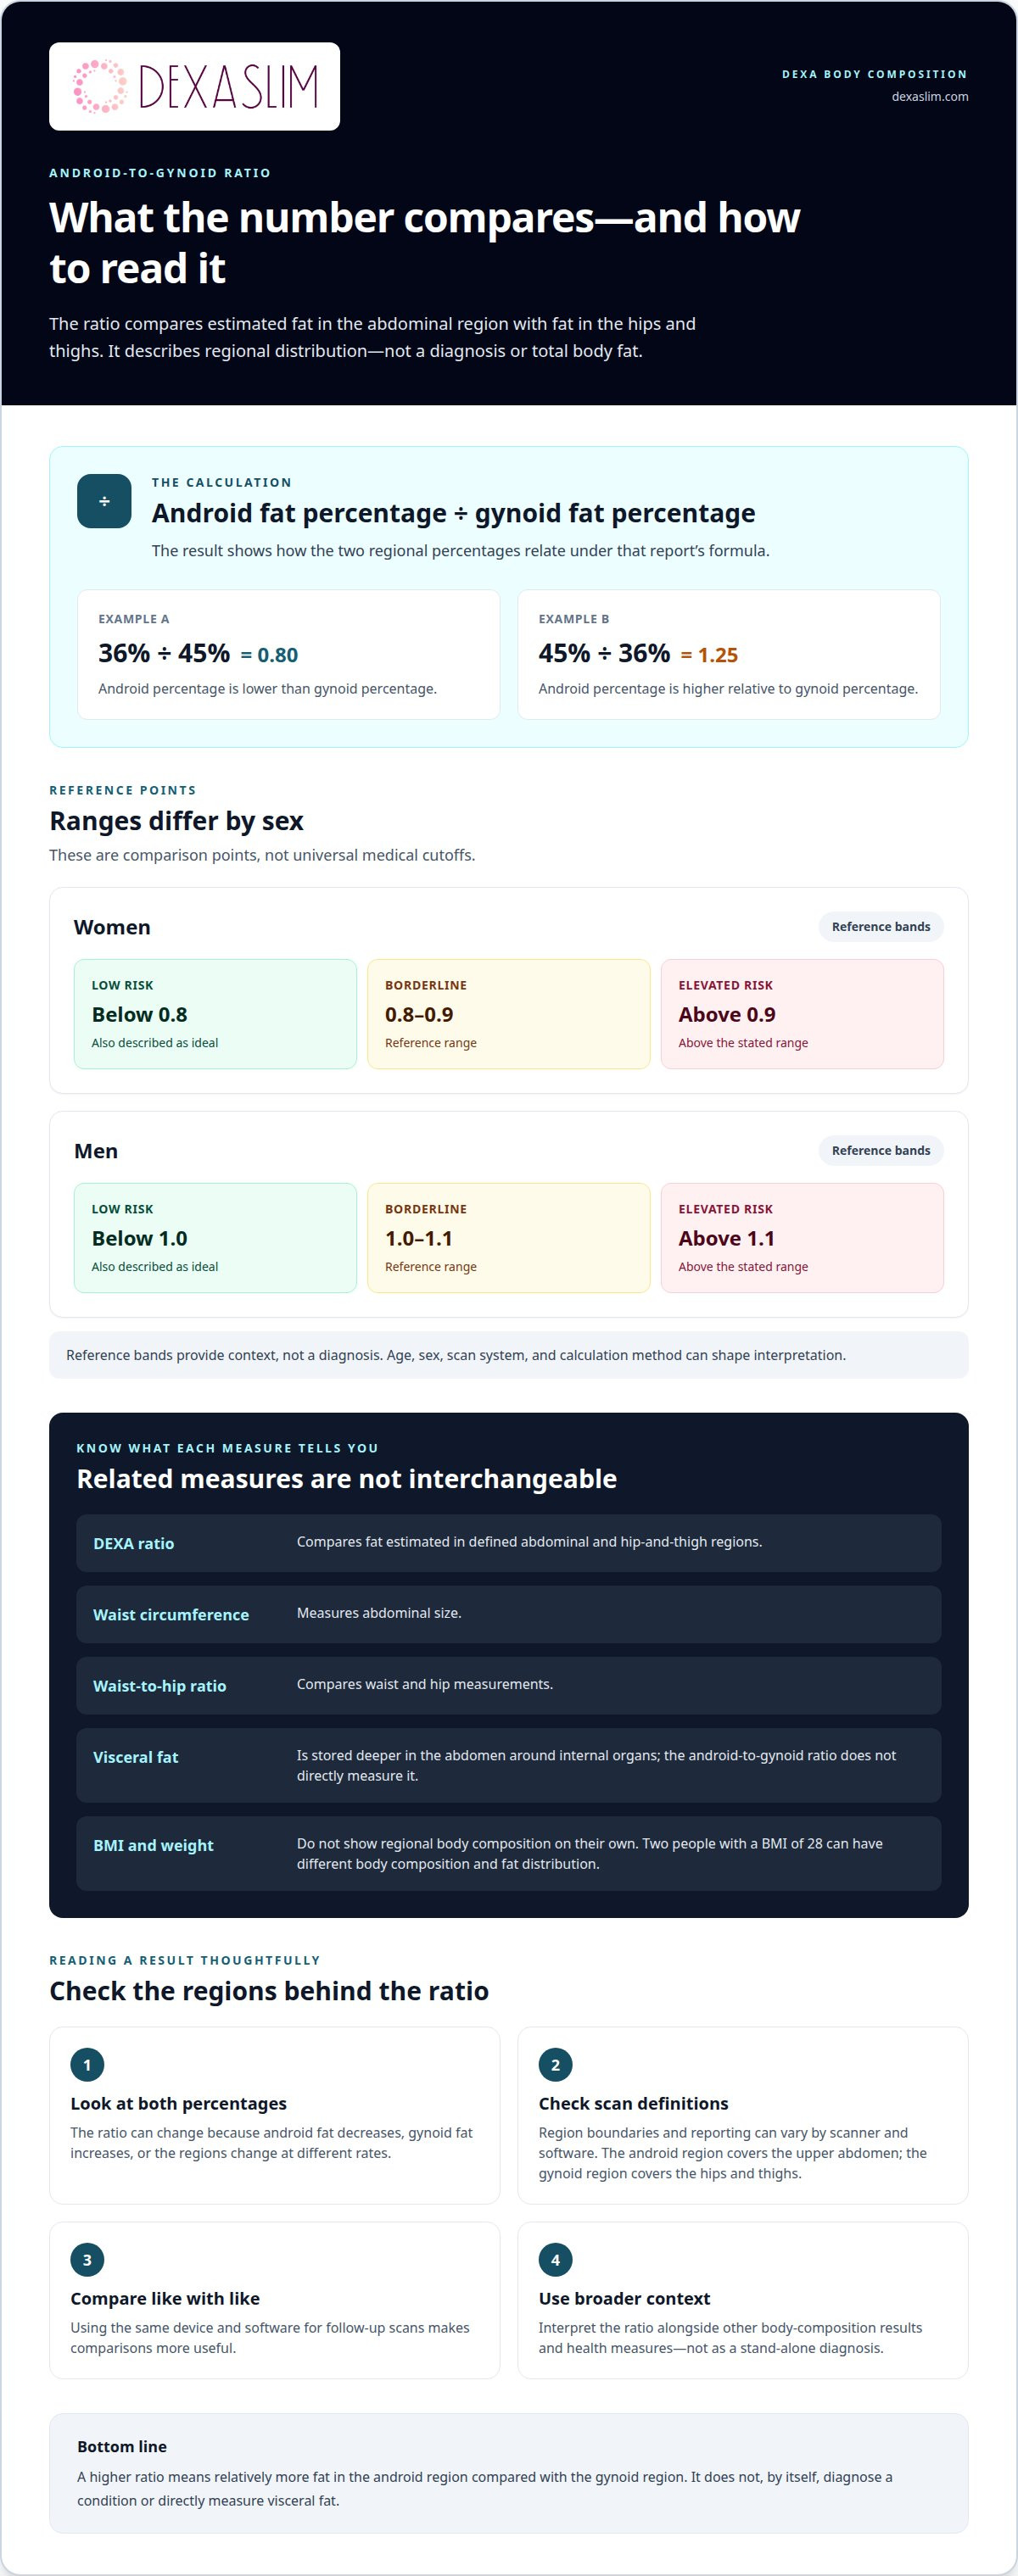
There isn’t one android-to-gynoid ratio that is ideal for everyone. Common reference points describe a ratio below 0.8 as ideal for women and below 1.0 for men. These are useful comparison points, not universal medical cutoffs. Age, sex, scan system, and calculation method all shape interpretation.
Professionals calculate the ratio by dividing android body fat percentage by gynoid body fat percentage. For example, 36% android fat divided by 45% gynoid fat equals 0.80. An android vs gynoid fat distribution DEXA comparison therefore shows how fat percentages relate across regions, not how much total body fat a person has.
Consider another example: 45% android fat divided by 36% gynoid fat equals 1.25. The android percentage is higher relative to the gynoid percentage under that report’s formula. A ratio above 1 isn’t automatically a diagnosis or a universal medical threshold; it describes the relationship between the two regional values.
Some reference bands describe ratios below 0.8 in women and below 1.0 in men as low risk. Values from 0.8 to 0.9 in women and 1.0 to 1.1 in men are described as borderline; values above those ranges are described as elevated risk. These ranges provide context, not a diagnosis. For android vs gynoid fat distribution DEXA results, interpret the ratio alongside the scan method and other health information.
A DEXA ratio is different from waist circumference and waist-to-hip ratio. Waist circumference measures abdominal size, while waist-to-hip ratio compares waist and hip measurements. DEXA estimates fat across defined body regions. These measures address related but distinct questions, so they are not interchangeable. Visceral fat sits deeper in the abdomen around the organs; an android-to-gynoid ratio compares broader regions rather than directly measuring visceral fat.
BMI adds another distinct measure. Two people with a BMI of 28 can have different body composition and fat distribution. DEXA provides regional information that BMI and weight alone don’t show. Adults over 40 may find the ratio particularly informative when tracking body composition alongside other health measures.
For useful comparisons over time, use the same device and software when possible. The ratio can fall because android fat decreases, gynoid fat increases, or the two regions change at different rates. Review the regional percentages alongside the ratio to see what actually shifted.
How DEXA defines android and gynoid regions
A DEXA body-composition scan divides the body into regions to estimate fat, lean tissue, and bone. The android region covers the upper abdomen, while the gynoid region covers the hips and thighs. Their boundaries are determined by the scan’s analysis method, not by waist measurements or visual estimates.
The CDC’s 2017-2018 NHANES DXA documentation places the android region in the lower trunk above the pelvic line. This gives the scan a defined area for estimating abdominal body fat. The gynoid region captures the hip-and-thigh area below the trunk. Together, the two regions let a report compare fat distribution across upper and lower body areas.
During a scan, DEXA uses low-dose X-rays to estimate tissue composition throughout the body. The system distinguishes estimates of fat, lean tissue, and bone based on how each affects the scan signal. Software applies region boundaries and reports measurements for each area. Android and gynoid percentages describe the fat estimated within those regions, not the share of total body weight made up by fat.
Region definitions and reporting can vary by scanner and software. This matters when comparing results: scans using the same device and software are more useful for tracking change than unrelated reports. A bone-density-only DEXA scan may not include the body-composition measurements needed to calculate an android-to-gynoid ratio.
In the United States, the cost of a DEXA body-composition scan depends on the scan and report. Dexaslim offers DEXA body-composition scans for precise regional data, including fat and lean-mass estimates.
DEXA provides regional estimates, but results can be affected by the scanner, software, positioning, and region boundaries. For clearer comparisons, use the same device and software for follow-up scans, and interpret regional percentages together. Research comparisons also depend on whether studies use matching definitions and analysis methods.
For preparation, UC Davis Health advises avoiding food for at least three hours before a DXA scan and avoiding procedures involving contrast dye for at least two weeks beforehand. Consistent preparation can support clearer comparisons between visits. Follow the scan facility’s instructions on positioning and any additional preparation.
Choose a professional DEXA body-composition scan when you need regional fat measurements rather than bone density alone. That distinction determines whether the report can show android and gynoid composition.
Android and gynoid fat distribution
DEXA compares fat in the abdominal region with fat around the hips and thighs. These patterns describe where fat is distributed, not a diagnosis or a judgment about what is normal.
Patterns of Android and Gynoid Fat
Android distribution describes fat stored around the abdomen, while gynoid distribution describes fat concentrated around the glutes, hips, and thighs. This distinction matters because people with similar body weights can carry fat in different regions. DEXA makes that contrast visible across defined areas, adding context that weight alone cannot provide.
An android pattern emphasizes abdominal fat; a gynoid pattern emphasizes the lower body. Neither label describes every fat depot. In particular, an android-region measurement covers a broad area and should not be mistaken for a direct measurement of internal visceral fat around the organs. Regional comparison and visceral-fat measurement answer related but different questions.
Gynoid fat is often described as less inflammatory and potentially protective, especially in women. That association does not mean hip fat prevents disease or establishes a person’s overall health. Distribution is only one part of body composition. Regional results are most useful when considered alongside other measurements and health indicators.
An android result describes fat in the abdominal region, while a gynoid result describes fat in the hip-and-thigh region. A scan report presents these as measured regions, not visual body-shape categories. This keeps interpretation grounded in DEXA data rather than assumptions based on appearance.
Differences Between Men and Women
Men typically show more android fat distribution, while women tend toward gynoid distribution. These are broad patterns, not rules for every individual. Sex-related patterns provide context when interpreting a scan, since the same regional result may have different reference contexts for men and women.
A woman’s DEXA report may show more fat around the hips and thighs, while a man’s may show greater abdominal concentration. Individual results vary. Age, body composition, and the scan’s calculation method all shape the regional comparison, so population patterns cannot replace a person’s own measurements.
Use the distinction as context, not as a label of normality. A higher android proportion describes relatively more abdominal fat; it does not establish disease. Likewise, a gynoid pattern does not prove low risk. Professionals interpret regional results alongside the rest of the scan and relevant health measures, rather than drawing conclusions from sex alone.
DEXA’s value is its ability to show how fat is distributed across defined regions in an individual. Android and gynoid labels help organize that information, while other assessments address separate questions. Treat the pattern as one measurable feature of body composition, not a complete account of health or future outcomes.
Central fat distribution and cardiometabolic risk
Fat concentrated around the abdomen can signal a different risk pattern from fat stored elsewhere. A higher android-to-gynoid ratio is associated with higher metabolic disease risk, but the ratio alone doesn’t diagnose a condition. It helps describe regional distribution, while other measurements assess separate parts of cardiometabolic health.
According to UC Davis Health, visceral adipose tissue is internal abdominal fat stored around the organs. Subcutaneous fat lies beneath the skin. These are distinct depots: an android-region result describes a broad abdominal area, while a visceral-fat measurement estimates deeper fat. The values are not interchangeable.
Visceral fat area offers another data point. UC Davis Health describes research indicating elevated risk associated with visceral adipose tissue at around 100-160 cm². A DEXA visceral fat area below 100 cm² is generally considered low risk, while an area above 160 cm² represents high metabolic risk. These thresholds add context, not a stand-alone diagnosis.
A higher android-to-gynoid ratio can be associated with increased visceral fat, impaired glucose metabolism, higher triglycerides, and inflammation. These associations help explain why central fat distribution can matter beyond appearance. The ratio compares regional fat percentages; it does not directly measure glucose control, blood lipids, or inflammation. Each measure contributes different information.
For example, a report may show an elevated regional ratio alongside a separate visceral-fat estimate. That combination can prompt closer attention to metabolic markers, rather than conclusions based on one number. Persistently elevated A/G ratios may make screening relevant. Measures such as fasting glucose, triglycerides, and HbA1c provide additional information about metabolic health.
Cardiovascular risk assessment requires more than body-composition data. A DEXA scan can clarify how fat and lean mass are distributed, but it does not replace blood testing or clinical evaluation. A professional can consider regional fat percentages, visceral-tissue estimates, and other available values together. The pattern matters, as does the wider health profile.
Use follow-up measurements to understand change without overinterpreting small differences. Comparisons are more useful when scans use the same device and software. A lower android-to-gynoid ratio may result from reduced android fat, increased gynoid fat, or changes in both regions. The regional values show what shifted, while metabolic testing can assess related health markers.
Keep the interpretation precise: central fat distribution is a risk-related signal, not proof of disease. Pair DEXA results with relevant metabolic markers for a more complete picture of cardiometabolic health.
How do android and gynoid fat distribution differ between men and women?
Men typically show more android fat distribution, while women tend toward gynoid distribution. These are population-level patterns, not rules for individual bodies. DEXA measures a person’s regional composition rather than assuming a pattern based on sex.
Android distribution describes a greater relative concentration of fat around the abdomen. Gynoid distribution describes more fat around the hips and thighs. By comparing these regions, DEXA can show whether one contributes a greater share of regional fat than the other. This adds context that body weight alone cannot provide.
Reference points also differ by sex. UC Davis Health describes an A/G ratio below 0.8 as ideal for women and below 1.0 as ideal for men. These points help frame a result, but they aren’t a universal cutoff for every person. Age, scan system, and calculation method also affect interpretation.
For example, a ratio of 0.85 falls above the stated ideal reference for women but below the stated ideal reference for men. That comparison illustrates why sex-specific context matters. It doesn’t establish a diagnosis or determine someone’s health status. The ratio describes relative regional fat distribution under the report’s calculation method.
Individual variation matters. A woman can have a more android pattern, and a man can have a more gynoid pattern. A DEXA report records the measured pattern rather than assigning a body-shape label. Interpretation should consider the actual regional values and scan method, not assumptions about how fat distribution should look in men or women.
Sex-specific reference points should not replace the rest of the assessment. A higher ratio indicates relatively more android distribution, but it does not diagnose diabetes or another condition. DEXA’s regional comparison does not directly measure every health marker. Other available measurements add context for interpreting body composition and metabolic health.
Consistency matters when comparing follow-up results. Using the same DEXA device and software makes changes easier to interpret than comparing reports from unrelated systems. A ratio can shift because abdominal fat changes, hip-and-thigh fat changes, or both regions change at different rates. Review the regional values to understand what changed rather than treating the ratio as a score on its own.
Use the result as an individualized data point, not a verdict based on sex. Explore a professional DEXA body-composition assessment to see how regional measurements can inform your personal baseline.
Dexaslim
Dexaslim helps turn regional body-composition results into a clearer personal baseline through its 1 Session Dexa Scan. If you want to understand android and gynoid measurements, a body-composition assessment can show how fat is distributed across those regions. The result describes distribution, not a diagnosis, and can be considered alongside other health measures.
For broader metabolic and performance context, Dexaslim also offers a Resting Metabolic Rate (RMR) Test, VO2 Max Performance Testing, and a Longevity Panel. These assessments address different aspects of health, so the most relevant next step depends on the questions you want your data to answer. Contact Dexaslim to discuss which assessment fits your goals.
Make Your Next Health Decision More Informed
Treat android vs gynoid fat distribution on DEXA as a starting point for a more focused conversation about your health data. The measurement can help clarify what you want to understand next, whether you’re establishing a body-composition baseline or considering how it fits alongside other assessments.
Start with a specific goal: a clearer picture of your body composition, a broader view of metabolic performance, or a way to track change over time. The right assessment depends on the question you want your data to answer. Dexaslim offers DEXA scans and complementary testing to support that process.
Use objective measurements to replace guesswork with a clearer plan. Contact Dexaslim about your DEXA scan and take the next step toward understanding your personal baseline. Your data can help you move forward with greater clarity and purpose.
Frequently Asked Questions
Can a lean person still have a high A/G ratio?
Yes. The android-to-gynoid ratio compares fat percentages in the two regions, so it reflects their relative distribution rather than total body fat. A lean person can have a higher ratio if the android percentage is greater relative to the gynoid percentage. For example, even a modest amount of body fat may be distributed more toward the abdomen. The ratio does not show total fat mass or diagnose a health condition.
How often should I repeat a DEXA scan to track my A/G ratio?
For general lifestyle changes, repeating a body-composition DEXA scan in six to twelve months can provide a useful comparison. During active body-composition change, a three-to-four-month interval allows time for shifts to accumulate. Use the same device and software for follow-up when possible, since different systems may define regions differently. Choose timing based on whether you’re monitoring gradual change or an active intervention, and compare regional measurements as well as the ratio.
What does the android region include?
The android region captures the abdominal portion analyzed by the DEXA body-composition software. In the CDC’s 2017-2018 NHANES DXA documentation, this region is placed in the lower trunk above the pelvic line. That defined area helps the system report regional composition rather than relying on a waist measurement. It represents a broad abdominal region, not a direct measurement of fat surrounding internal organs.
What information can I get from a DXA Body Composition scan?
A DEXA body-composition scan estimates fat, lean tissue, and bone throughout the body, then reports how these components are distributed across regions. Depending on the scan and report, results may include regional fat measurements and an android-to-gynoid comparison. This can help distinguish changes in fat from changes in lean mass. A bone-density-only scan is different and may not include the body-composition data needed for regional fat analysis.
What are android and gynoid fat distribution patterns?
Android and gynoid patterns describe where fat is relatively concentrated, not how much a person weighs. An android pattern emphasizes the abdominal region; a gynoid pattern emphasizes the glutes, hips, and thighs. A person can have a mixture of both. Regional values can clarify what changed during body-composition tracking, even when scale weight alone cannot show whether fat or lean tissue shifted.
How does DEXA measure android and gynoid fat?
DEXA uses X-ray measurements and analysis software to estimate fat, lean tissue, and bone in selected body regions. The software applies defined boundaries to identify android and gynoid areas, then reports regional composition. Results depend in part on the scanner and analysis method. For trend tracking, use the same device and software so differences between reports are less likely to reflect a change in calculation.
Where are the android and gynoid regions on a DEXA scan?
The android region is in the abdominal area of the lower trunk, above the pelvic line in the CDC’s 2017-2018 NHANES DXA documentation. The gynoid region covers the hips and thighs. On a report, these are software-defined analysis areas rather than borders drawn from clothing size or waist circumference. Their regional values let the report compare upper-body and lower-body fat distribution.
What is the android-to-gynoid fat ratio and how is it calculated?
The android-to-gynoid ratio compares the fat percentages reported for those two regions. Calculate it by dividing the android body-fat percentage by the gynoid body-fat percentage. For example, 36% android fat divided by 40% gynoid fat gives a ratio of 0.90. Read the ratio alongside both regional percentages, because the same ratio can result from different values in each region.