.svg)

For routine clinical assessment, fasting HOMA-IR and the TyG index remain the workhorses, with QUICKI as a corroborating check when insulin assays are reliable. The euglycemic-hyperinsulinemic clamp still anchors validation studies, but it belongs in research protocols, not the clinic. Molecular markers like adiponectin and hs-CRP add mechanistic texture rather than diagnostic certainty, and every cutoff you use should be checked against your lab’s assay and your patient’s population.
TL;DR:
- Fasting HOMA-IR and TyG are practical surrogate tests for insulin resistance, but they are less precise than clamp studies, which remain the gold standard mainly for research.
- Lipid-based indices like TyG and TG/HDL are valuable alternatives when insulin assays are unavailable or unreliable, especially in patients on insulin therapy.
- Body composition assessment through DEXA or waist-to-height ratio provides critical context by distinguishing fat loss from muscle loss during metabolic interventions.
- Molecular markers such as adiponectin and hs-CRP have limited routine use, but can add mechanistic insights or be useful in advanced phenotyping and research settings.
- Standardization issues with insulin assays and metabolomic panels mean serial testing with the same lab and method is essential for accurate trend analysis.
Table of Contents
- What Is the Gold Standard for Measuring Insulin Resistance?
- How Do You Calculate HOMA-IR and QUICKI?
- Are Lipid-Based Indices Better Than Insulin-Based Ones?
- What Molecular Biomarkers Signal Insulin Resistance?
- Does Body Composition Improve Insulin Resistance Assessment?
- How Should Clinicians Interpret Insulin Resistance Test Results?
- Which Markers Should You Order for Each Clinical Scenario?
- How Precision Body Composition Complements Marker-Based Testing
- What Genetic Factors Influence Insulin Resistance Risk?
- Can Gut Microbiota Metabolites Predict Insulin Resistance?
- Which Imaging Techniques Assess Insulin Resistance-Related Changes?
- Why Do Novel Insulin Resistance Assays Face Standardization Problems?
- Clinical Perspective: Balancing Evidence and Practicality
- Get Body Composition Data That Complements Your Bloodwork
- Sources
- FAQ
What Is the Gold Standard for Measuring Insulin Resistance?
The hyperinsulinemic-euglycemic clamp is the reference method against which every surrogate index gets judged, and it earns that status by directly measuring how much glucose a person’s tissues can dispose of under a fixed insulin infusion. A clinician infuses insulin at a constant rate while adjusting a simultaneous glucose infusion to hold blood glucose at a steady, normal level. The glucose infusion rate needed to maintain euglycemia becomes the readout: lower rates mean more resistance, higher rates mean better sensitivity.
It is also, frankly, not something you can order for a Tuesday afternoon appointment. The technique demands arterial or arterialized venous sampling, a trained research team, several hours of continuous monitoring, and repeat blood draws every five to ten minutes to titrate the glucose drip. StatPearls lists it as the accepted reference standard precisely because it isolates insulin action from confounding variables like endogenous insulin secretion and hepatic glucose output, something no fasting blood draw can do. That precision comes at the cost of practicality: the clamp requires constant insulin infusion and frequent glucose monitoring, which makes it impractical for routine clinical use outside specialized metabolic research units.
Between the clamp and a single fasting draw sits a middle tier of dynamic tests that trade some precision for feasibility.
- Intravenous glucose tolerance test (IVGTT): A bolus of glucose is given intravenously, and frequent blood samples track glucose and insulin over roughly three hours. Minimal model analysis of these curves yields an insulin sensitivity index that correlates reasonably well with clamp values, though it still requires an infusion pump and dedicated staff time.
- Oral glucose tolerance test (OGTT)-derived indices: A standard 75-gram OGTT with glucose and insulin measured at baseline, 30, 60, 90, and 120 minutes allows calculation of the Matsuda index (also called ISI), which estimates whole-body insulin sensitivity by combining fasting and post-load values. The Measuring and Estimating Insulin Resistance review found OGTT-derived indices track closely with clamp-based sensitivity in populations with a range of glucose tolerance, making them a reasonable compromise when a full clamp isn’t feasible.
- Insulinogenic index and disposition index: These pull double duty, capturing both insulin secretion and sensitivity from the same OGTT dataset, which matters for phenotyping patients who have compensated with high insulin output rather than true normal sensitivity.
So when does the added complexity of dynamic testing actually pay off? Three scenarios stand out. Research protocols that need to detect small treatment effects, where the noise of a single fasting draw would swamp the signal, benefit from OGTT-based indices. Detailed metabolic phenotyping, say, distinguishing hepatic from peripheral insulin resistance in a patient with unexplained fatty liver, sometimes requires the two-step clamp with tracer infusion, a technique that’s essentially clamp-plus. And drug development trials evaluating novel insulin sensitizers lean on the clamp or IVGTT because regulatory bodies expect that level of rigor before approving a mechanism-of-action claim.
For everyone else, that means specialists and researchers, not the primary care clinician managing a patient with prediabetes, the fasting surrogates covered next do the job with far less friction.
How Do You Calculate HOMA-IR and QUICKI?
HOMA-IR is calculated as fasting insulin (µU/mL) multiplied by fasting glucose (mg/dL), divided by 405. If your lab reports glucose in mmol/L instead, the divisor changes to 22.5, and getting that unit conversion wrong is one of the most common calculation errors in clinical charts. A patient with a fasting insulin of 12 µU/mL and fasting glucose of 95 mg/dL has a HOMA-IR of (12 × 95) / 405, or roughly 2.8.
QUICKI takes the same two inputs but transforms them logarithmically: 1 divided by [log(fasting insulin in µU/mL) + log(fasting glucose in mg/dL)]. Because it uses log transformation, QUICKI values run in a much narrower range, typically between 0.30 and 0.45, with lower values indicating more resistance. That narrowband makes QUICKI feel less intuitive at the bedside, but validation work shows it correlates more consistently with clamp-derived sensitivity across a wider range of insulin levels than the untransformed HOMA-IR does, particularly in more insulin-resistant patients where HOMA-IR’s linear scale gets skewed by outliers.
The McAuley index adds triglycerides to the mix, which matters for patients where lipid handling is part of the clinical question. It’s calculated as exp[2.63 − 0.28 × ln(fasting insulin in µU/mL) − 0.31 × ln(fasting triglycerides in mmol/L)]. Because triglycerides need to be in mmol/L for this formula (divide mg/dL by 88.5 to convert), it’s worth double checking your lab’s reporting units before you plug in numbers.
Statistic Callout: QUICKI and the log-transformed HOMA-IR (Log-HOMA) show strong correlation with clamp-derived insulin sensitivity, with validation studies reporting correlation coefficients in the 0.8 to 0.9 range, according to the PMC review on measuring insulin resistance. That level of agreement is why both indices remain first-line surrogates in settings where the clamp isn’t available.
HOMA2 is the calculator-based successor to the original HOMA model, and it’s a meaningfully different tool, not just an updated formula. Rather than a simple linear equation, HOMA2 uses a computer model that accounts for variations in hepatic and peripheral glucose resistance, circulating proinsulin, and renal glucose loss, which makes it more accurate across a wider range of glucose and insulin values, especially in patients with impaired fasting glucose or established diabetes. HOMA2 also accepts C-peptide as an input instead of insulin, which is genuinely useful in a specific clinical situation: patients on exogenous insulin therapy, where a measured insulin level reflects injected insulin rather than endogenous secretion. C-peptide, cleared more slowly and not affected by exogenous insulin, gives a cleaner read on the pancreas’s own output in that population.
A few practical notes worth keeping on hand:
- HOMA-IR cutoffs are not standardized across labs or populations; a value of 2.5 might flag resistance in one reference population and sit within normal range in another with different average adiposity.
- Insulin assays themselves vary by manufacturer and lack full standardization, meaning the same blood sample can yield different HOMA-IR values depending on which assay platform processed it.
- Fasting status matters more than people assume. A patient who “mostly fasted” but had coffee with cream three hours before the draw can show artificially elevated insulin.
- Trend over time, using the same lab and assay, is more clinically meaningful than a single value compared against a published cutoff from a different population.
StatPearls and other clinical references list HOMA-IR, HOMA2, and QUICKI alongside triglyceride-based markers as the clinically useful surrogate measures precisely because they require only a fasting blood draw. That accessibility is the whole reason they’ve displaced the clamp in everyday practice, even though none of them match its precision.
Are Lipid-Based Indices Better Than Insulin-Based Ones?
Lipid-based indices solve a real problem: insulin assays are expensive, poorly standardized between labs, and useless in patients on insulin therapy. The Triglyceride-Glucose (TyG) index sidesteps all three issues by using only fasting triglycerides and fasting glucose, both of which are cheap, widely available, and consistently measured across labs.
TyG is calculated as ln[fasting triglycerides (mg/dL) × fasting glucose (mg/dL) / 2]. Most studies use a cutoff within a certain range to flag insulin resistance, though the exact threshold shifts by population. A PLOS One comparison of 25 different indices found TyG performed strongly for detecting prediabetes-related insulin resistance, reporting a strong discriminative performance, which puts it in the same performance tier as several insulin-dependent indices without requiring an insulin assay at all.
Statistic Callout: A cohort analysis reported in Frontiers in Endocrinology found TyG cutoffs and diagnostic performance varying substantially by population, with one Middle Eastern cohort reporting a high AUC at a specific threshold. That spread is the whole argument for validating cutoffs locally rather than importing a number from a paper studying a different population.
The TG/HDL ratio is even simpler, dividing fasting triglycerides by HDL cholesterol, both in mg/dL. A ratio above 3.0 to 3.5 is commonly used to flag insulin resistance risk, but this index carries a real caveat: it performs less reliably in populations with different baseline lipid patterns. Women, in general, run higher HDL than men at equivalent insulin sensitivity, and ethnic variation in lipid metabolism (South Asian populations, for instance, often show adverse metabolic risk at lower TG/HDL ratios than white European reference ranges) means a single universal cutoff misclassifies people at the margins.
Where lipid-based indices earn their keep clinically:
- Patients on exogenous insulin, where measured insulin levels are meaningless for calculating HOMA-IR or QUICKI.
- Settings without reliable access to standardized insulin assays, which describes a meaningful share of primary care and community health settings.
- Serial monitoring situations where cost matters, since a lipid panel run alongside routine metabolic labs adds no extra blood draw or assay expense.
- Patients with erratic insulin secretion patterns (early type 1 diabetes, some pancreatic conditions) where insulin-based math doesn’t reflect peripheral resistance accurately.
Combining a lipid-based index with a body-composition or anthropometric measure improves discrimination further. TyG-BMI multiplies the TyG value by BMI, and TyG-WC substitutes waist circumference. The PLOS One comparison found these hybrid indices, particularly TyG-WHtR (waist-to-height ratio), reaching AUCs around 0.80, edging out TyG alone. The Lipid Accumulation Product (LAP) and Visceral Adiposity Index (VAI) work on a similar principle, folding waist circumference and triglycerides (and, for VAI, HDL and BMI) into a single composite score that tracks visceral fat burden more closely than any single lab value can.
None of these lipid-based tools replace a direct insulin measurement when one is available and reliable. But for screening, for monitoring trends over months, and for patients where insulin assays are impractical, they hold their own.
What Molecular Biomarkers Signal Insulin Resistance?
Adiponectin runs in the opposite direction from most metabolic risk markers: lower levels signal higher insulin resistance, not higher. This adipokine, secreted by fat tissue, improves insulin sensitivity in muscle and liver, and its levels tend to drop as visceral fat accumulates, which is part of why lean people with metabolically healthy fat distribution often show higher adiponectin than someone with the same BMI carrying more visceral adiposity.
High-sensitivity C-reactive protein (hs-CRP) tracks the low-grade inflammatory state that accompanies insulin resistance, though it’s a marker of systemic inflammation broadly, not insulin resistance specifically, so a recent infection or autoimmune flare will confound the reading. IGFBP-1 (insulin-like growth factor binding protein 1) drops when insulin is chronically elevated, since insulin suppresses its hepatic production, making it a rough inverse proxy for hyperinsulinemia. Ferritin, an acute-phase reactant, correlates with insulin resistance in several population studies, likely through a shared pathway involving hepatic fat accumulation and low-grade inflammation, though elevated ferritin also shows up in iron overload states unrelated to metabolic disease. TNF-alpha and sCD36 are more mechanistic than diagnostic. Both are studied for their role in the inflammatory and lipid-handling pathways that drive resistance at the cellular level, but neither has a validated clinical cutoff you’d use to flag a patient.
Here’s where these markers sit relative to routine testing:
- Adiponectin: research and mechanistic phenotyping; not routinely ordered in primary care.
- hs-CRP: widely available, useful for cardiovascular risk stratification, weaker as a standalone insulin resistance marker.
- IGFBP-1: mostly a research tool; limited clinical assay availability.
- Ferritin: routinely available, but interpret alongside iron studies to rule out overload.
- TNF-alpha, sCD36: essentially research-only at this point, rarely ordered outside academic studies.
Metabolomic-derived composite scores represent the next tier up in complexity. Quantose incorporates metabolites like alpha-hydroxybutyrate and lysophosphatidylcholine (L-GPC) alongside standard glucose and insulin measures to generate a proprietary insulin resistance score. The Lipoprotein Insulin Resistance (LPIR) score, derived from NMR spectroscopy of lipoprotein particle subfractions, has shown ability to predict progression to type 2 diabetes in some cohorts. The Endotext chapter on metabolomic markers describes both as promising but currently constrained by cost, limited insurance coverage, and the need for broader validation before they displace fasting glucose and insulin as first-line tools.
Pro Tip: If you’re ordering hs-CRP or ferritin as part of a metabolic workup, pull a recent infection and iron-panel history first. Both markers rise for reasons that have nothing to do with insulin resistance, and an isolated elevated value without that context can send you down the wrong diagnostic path.
These molecular and metabolomic markers add the most value in three settings: mechanistic research trying to understand why resistance developed, phenotyping patients who don’t fit the typical metabolic syndrome pattern, and monitoring response to novel therapies in clinical trials where a sensitive, early-changing biomarker matters more than a cheap one.
Does Body Composition Improve Insulin Resistance Assessment?
Waist circumference and waist-to-height ratio consistently outperform BMI for flagging insulin resistance risk, and the reason is straightforward: BMI can’t distinguish between a muscular frame and a fat-dominant one, but visceral fat, the metabolically active tissue driving most of the insulin resistance signal, concentrates around the waist. A patient with a normal BMI but a high waist-to-height ratio (generally flagged above 0.5) carries real metabolic risk that BMI alone would miss entirely, a pattern sometimes called “normal weight obesity.”
DEXA scanning goes a step further than a tape measure by directly quantifying visceral adipose tissue mass and separating it from subcutaneous fat and lean mass, giving a body-composition picture that anthropometric measures can only estimate indirectly. This matters clinically in two specific ways. First, it lets you track whether an intervention (weight loss, resistance training, a GLP-1 medication) is actually reducing visceral fat specifically, rather than just moving the scale number, which can reflect muscle loss just as easily as fat loss. Second, lean mass tracking flags a failure mode that biochemical markers alone will miss: a patient whose HOMA-IR improves on a calorie-restricted diet but who is losing meaningful muscle mass in the process, a pattern that often predicts weight regain and metabolic backsliding later.
Bioimpedance analysis (BIA) offers a cheaper, more portable alternative to DEXA for estimating body fat percentage and, in some composite indices, insulin sensitivity directly. The PLOS One comparison noted a bioimpedance-derived index (B-SAI) reaching an AUC around 0.82 in one cohort, competitive with several blood-based indices, though BIA accuracy varies more than DEXA with hydration status and device calibration.
Practical guidance for choosing between these tools:
- Use waist circumference or waist-to-height ratio as a quick, no-cost screening addition to any fasting lab panel.
- Reach for DEXA when you need to separate visceral fat change from lean mass change during an intervention, particularly for patients on GLP-1 therapy or in a structured weight-loss program.
- Consider bioimpedance as a lower-cost, more frequent monitoring option between periodic DEXA scans, understanding it trades some precision for accessibility.
- Don’t rely on BMI alone to rule out metabolic risk in a patient with other suggestive symptoms or family history.
How Should Clinicians Interpret Insulin Resistance Test Results?
No index has a cutoff that travels cleanly across every population, and treating a published threshold as universal is one of the more common misreadings in this field. A HOMA-IR of 2.5 might indicate real resistance in a lean population with low baseline insulin secretion, but sit comfortably within normal variation in a population with different average adiposity and insulin dynamics. The same caveat applies to TyG, TG/HDL, and every composite index built on top of them.
A few confounders deserve a second look before you act on a single elevated value:
- Recent illness or acute stress, which transiently raises both glucose and inflammatory markers independent of baseline insulin sensitivity.
- Medications, particularly corticosteroids, some antipsychotics, and thiazide diuretics, which can shift glucose and insulin readings without reflecting a true change in underlying resistance.
- Incomplete fasting, since even a small caloric intake within a few hours of the draw can meaningfully skew insulin and triglyceride values.
- Assay platform changes, since switching labs or insulin assay methods mid-monitoring can create an apparent trend that’s really just a measurement artifact.
- Menstrual cycle phase and recent exercise, both of which shift insulin sensitivity acutely in ways that a single fasting draw won’t capture.
Statistic Callout: LabTestsOnline notes that no single laboratory test diagnoses insulin resistance on its own, recommending clinicians interpret glucose, lipid panel, and insulin or C-peptide results together against the full clinical picture rather than any one number in isolation.
For reporting and documentation, three habits pay off over time. Always record the assay method and lab reference range alongside the raw value, since a HOMA-IR of 2.8 means something different depending on which insulin assay generated the fasting insulin figure. Document fasting duration and any relevant recent illness or medication changes in the same note as the lab order, so a future clinician reviewing the trend isn’t guessing at confounders. And favor trend-based interpretation, the same assay, same lab, tracked over three to six month intervals, over any single value compared against a textbook cutoff. HOMA-IR cutoffs are not universal, and clinicians get more diagnostic value from watching a patient’s own trajectory than from chasing a fixed threshold borrowed from a study population that may not resemble the person in front of them.
Which Markers Should You Order for Each Clinical Scenario?
The right marker panel depends entirely on what question you’re answering, and over-ordering rarely adds clinical value proportional to its cost.
Screening bundle for a general population health check or a patient with risk factors but no specific metabolic complaint: fasting glucose and HbA1c, plus TyG or TG/HDL calculated from a standard lipid panel you’re likely already ordering. Add fasting insulin and HOMA-IR only if the screening bundle flags abnormal results or if the patient has a strong family history warranting closer surveillance.
Specialist evaluation bundle for a patient referred with confirmed prediabetes, PCOS, or unexplained metabolic syndrome features: HOMA2 (using the calculator model rather than the simple linear formula), QUICKI as a corroborating check, a full lipid panel, hs-CRP, and a body-composition assessment via DEXA or bioimpedance to characterize visceral fat and lean mass alongside the biochemical picture.
Research-grade bundle for phenotyping studies or drug development protocols: clamp-derived or OGTT-derived indices (Matsuda, disposition index), paired with metabolomic panels where budget allows, and repeat DEXA scans to track visceral fat and lean mass changes as objective, mechanism-independent endpoints.
- Screening: fasting glucose/HbA1c + TyG or TG/HDL, escalate to HOMA-IR if flagged.
- Specialist: HOMA2, QUICKI, lipid panel, hs-CRP, DEXA or bioimpedance.
- Research: clamp or OGTT-derived indices, metabolomics, serial DEXA.
Pro Tip: When monitoring a patient through a weight-loss or GLP-1 treatment course, pair a fasting marker like HOMA-IR or TyG with a DEXA scan every three to four months rather than relying on the scale. Insulin sensitivity can improve before visible weight change shows up, and DEXA will tell you whether the change is coming from fat loss or muscle loss.
Monitoring cadence generally runs every three to six months for stable patients on lifestyle or pharmacologic intervention, tightened to monthly only in research protocols or when titrating a medication with known metabolic effects.
How Precision Body Composition Complements Marker-Based Testing
Biochemical markers tell you insulin sensitivity is changing; they don’t tell you why. A falling HOMA-IR after three months of a GLP-1 regimen or a structured training program could reflect visceral fat loss, which is the desired outcome, or it could partly reflect lean mass loss, which predicts a harder time keeping the improvement long term. DEXA-derived visceral fat and lean mass measurements fill that mechanistic gap, giving clinicians and patients a way to see which tissue compartment is actually driving the biochemical change.
DEXA scanning measures visceral fat and lean mass directly and can be complemented by blood biomarker panels alongside VO2 Max and Resting Metabolic Rate testing that add metabolic context around energy expenditure and fitness capacity. None of these tools replace a HOMA-IR calculation or a fasting lipid panel; they sit alongside them, adding the body-composition dimension that a blood draw alone can’t capture.
For a clinician managing a patient through a weight-loss intervention, that combination, biochemical trend plus visceral fat trend, offers a more complete read on whether an intervention is working the way it’s supposed to. A patient whose TyG index is improving while their DEXA scan shows visceral fat holding steady and lean mass declining is a different clinical picture than one where both visceral fat and TyG are moving in the same favorable direction, even if the scale reads identically for both.

What Genetic Factors Influence Insulin Resistance Risk?
Genetic variation explains a meaningful share of why insulin resistance clusters in families independent of shared diet or activity patterns, though no single gene test diagnoses the condition. Variants in the TCF7L2 gene, the strongest and most replicated genetic association with type 2 diabetes risk across populations, influence insulin secretion more directly than peripheral insulin action, but they shift overall metabolic risk in ways that compound with acquired insulin resistance.
The PPARG gene, particularly the Pro12Ala variant, affects adipocyte differentiation and insulin sensitivity in fat tissue, with the more common Pro allele associated with somewhat higher insulin resistance risk compared to the less common Ala variant. Variants near IRS1 (insulin receptor substrate 1) directly affect the insulin signaling cascade inside cells, and disruptions here can produce insulin resistance that doesn’t track cleanly with body weight, explaining some of the lean patients with unexplained metabolic syndrome features. FTO gene variants, more commonly associated with obesity risk broadly, contribute an indirect pathway to insulin resistance largely through their effect on appetite regulation and fat mass accumulation rather than a direct effect on insulin signaling.
None of these genetic markers are part of routine clinical insulin resistance workups today, and no clinical guideline recommends universal genetic screening for this purpose. Their value right now sits mainly in research contexts, explaining population-level variation in disease risk and, increasingly, in refining polygenic risk scores that combine dozens of variants into a single risk estimate, though those composite scores remain investigational tools rather than clinical decision aids.
Can Gut Microbiota Metabolites Predict Insulin Resistance?
The gut microbiome influences insulin sensitivity through metabolites that enter systemic circulation and interact with liver and muscle metabolism, a research area that has expanded considerably as sequencing costs have dropped. Short-chain fatty acids, produced when gut bacteria ferment dietary fiber, generally support insulin sensitivity by improving gut barrier function and reducing the low-grade inflammation that drives resistance, making fiber intake a plausible mechanistic link between diet and metabolic health beyond simple calorie counting.
Trimethylamine N-oxide (TMAO), a metabolite produced when gut bacteria process dietary choline and carnitine (found heavily in red meat and eggs), shows the opposite pattern in several studies, correlating with worse insulin sensitivity and cardiovascular risk. Branched-chain amino acids (BCAAs), while partly diet-derived, are also metabolized differently depending on gut microbial composition, and elevated circulating BCAA levels are one of the more consistent metabolomic signatures associated with insulin resistance across multiple study cohorts.
None of these microbiota-derived metabolites have moved into routine clinical testing yet. The field faces real hurdles: microbiome composition varies enormously between individuals and shifts with diet, medication, and even time of day, making a single stool or blood sample a noisy snapshot of a moving target. Assay standardization is still developing, and causality remains genuinely unsettled for several of these metabolites. Whether microbiota changes cause insulin resistance or simply reflect the same dietary and inflammatory patterns that also drive resistance directly is still being worked out in ongoing cohort studies. For now, these markers belong in research protocols and mechanistic studies, not in a standard metabolic workup.
Which Imaging Techniques Assess Insulin Resistance-Related Changes?
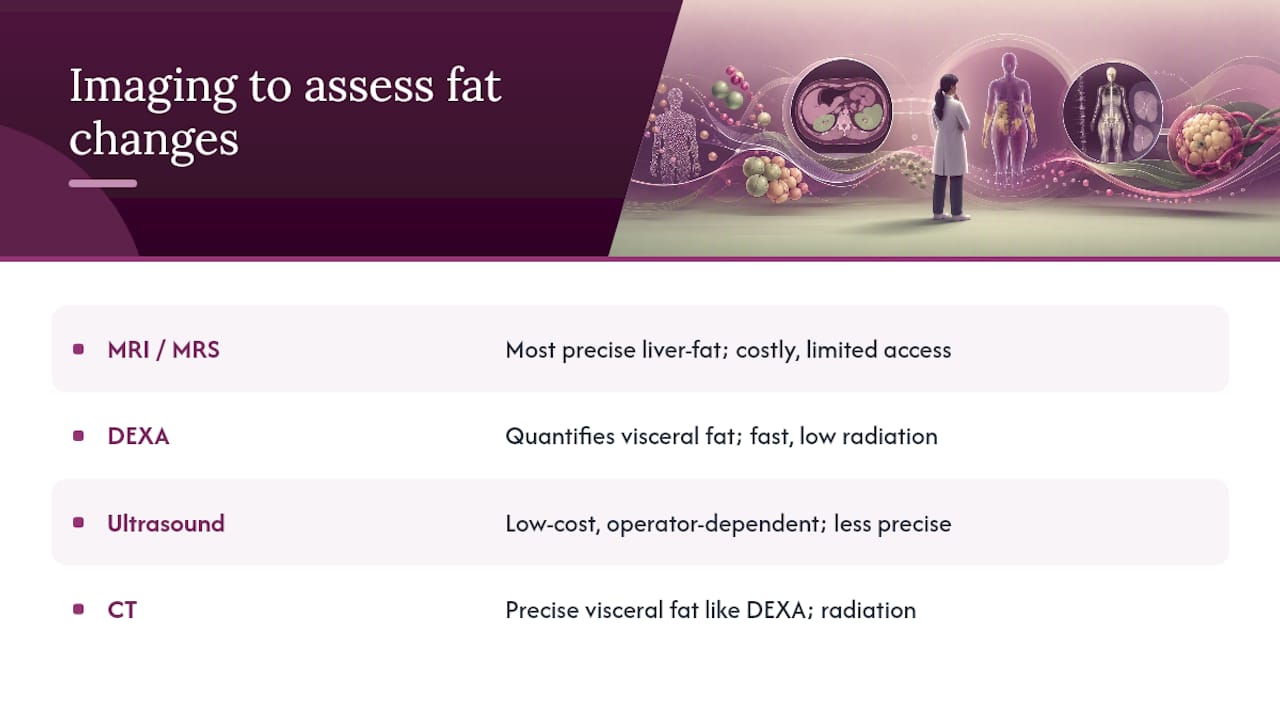
Imaging doesn’t measure insulin resistance directly, but several techniques capture the tissue changes, visceral fat accumulation, hepatic fat infiltration, that closely track with it, and the choice between them comes down to what question you’re answering and what resources you have access to.
MRI-based methods, particularly magnetic resonance spectroscopy (MRS), offer the most precise noninvasive quantification of liver fat content, detecting hepatic steatosis at a level of sensitivity that outperforms most other imaging modalities. This matters because nonalcoholic fatty liver disease and insulin resistance are tightly linked, and MRS-quantified liver fat correlates strongly with hepatic insulin resistance specifically, as distinct from peripheral (muscle) insulin resistance. The tradeoff is cost and availability. MRS requires specialized software and expertise that most imaging centers don’t have on hand for routine use.
DEXA scanning, more widely available and considerably faster than MRI, doesn’t visualize fat within organs the way MRS does, but it precisely quantifies total and regional visceral adipose tissue mass, giving a strong proxy for the fat depot most closely tied to insulin resistance risk. Its practicality, a scan takes minutes and radiation exposure is minimal, makes it far more feasible for repeat monitoring over the course of an intervention than MRI-based methods.
Ultrasound offers a lower-cost option for estimating hepatic steatosis and, to a lesser degree, visceral fat thickness, though it’s more operator-dependent and less precise for tracking small changes over time than either DEXA or MRI. CT scanning can quantify visceral fat with precision comparable to DEXA but carries radiation exposure that makes it a poor choice for repeat monitoring in most clinical or research settings.
For repeat, longitudinal tracking of visceral fat change alongside biomarker trends, DEXA generally offers the best balance of precision, speed, and radiation safety among these options.
Why Do Novel Insulin Resistance Assays Face Standardization Problems?
Insulin immunoassays vary meaningfully between manufacturers, and that variation is not a minor footnote, it’s a real source of clinical confusion. Two labs running the same patient’s blood sample on different assay platforms can report insulin values that differ enough to shift a HOMA-IR calculation across a diagnostic threshold, even though nothing about the patient’s actual physiology changed. This is part of why HOMA-IR cutoffs are not universal and why comparing a value from one lab against a cutoff derived from a different lab’s assay platform is a common source of misclassification.
Newer molecular and metabolomic assays face an even steeper standardization climb. Proprietary panels like Quantose rely on specific metabolite combinations measured on specialized platforms that aren’t broadly available across commercial labs, which means results aren’t easily reproducible or comparable across institutions the way a basic metabolic panel is. NMR-based lipoprotein scores like LPIR depend on spectroscopy equipment and processing algorithms that vary between the handful of labs currently offering the test.
Reference ranges compound the problem. Most published cutoffs for indices like TyG or TG/HDL come from specific study populations, often a particular country, age range, or ethnic group, and applying that cutoff to a different population without local validation risks systematic misclassification in either direction. The Frontiers cohort data showing dramatically different TyG cutoffs and AUC values between populations illustrates exactly this problem: a threshold validated in one cohort doesn’t automatically transfer to another.
Until assay manufacturers converge on standardized reference methods and more labs adopt shared calibration standards, the practical fix is consistency: use the same lab and assay for a given patient’s serial monitoring, and treat any cross-lab or cross-platform comparison with real caution.
Clinical Perspective: Balancing Evidence and Practicality
The honest tension in this field isn’t whether these markers work. It’s how much confidence to place in any single number. HOMA-IR and TyG earn their place as first-line tools because they’re cheap, reproducible enough, and validated across thousands of patients, not because they’re precise in the way a clamp is precise. Treating a single elevated value as a diagnosis, rather than a data point in a trend, is where clinical judgment gets replaced by pattern matching.
Metabolomic scores like LPIR and Quantose represent a genuinely promising direction, capturing biology that a fasting glucose and insulin pair simply can’t see. But promising research tools and ready-for-clinic tools are different categories, and conflating them does patients a disservice. The field needs standardized assay methods and population-specific validation studies before these move from cohort research into everyday practice. Until then, pairing validated fasting surrogates with body-composition data gives the most defensible picture available, and it beats waiting for a perfect single biomarker that may never arrive.
— Fitpal
Get Body Composition Data That Complements Your Bloodwork
A HOMA-IR trend or a TyG calculation tells you insulin sensitivity is shifting. It doesn’t tell you whether that shift is coming from visceral fat loss, muscle loss, or both at once, and that distinction changes how you’d counsel a patient. Dexaslim’s DEXA Scan measures visceral fat and lean mass directly, giving clinicians and patients the tissue-level context that a blood draw alone can’t provide.

The Longevity Panel covers the blood biomarkers discussed throughout this piece, and pairing it with a DEXA scan, plus VO2 Max or Resting Metabolic Rate testing when fitness capacity or energy expenditure is part of the clinical picture, builds a monitoring bundle that tracks both the biochemistry and the body composition driving it. A DEXA Scan runs $179 as a one-time scan, and a standalone Longevity Panel is $399. For clinicians weighing whether to refer a patient for integrated testing, the DEXA plus panel combination makes the most sense when biochemical markers alone leave the mechanism of change ambiguous, particularly during a GLP-1 treatment course or a structured weight-loss program where distinguishing fat loss from muscle loss matters for long-term outcomes. Find a testing location near you and book a scan through Dexaslim’s site locator.
Sources
The sources below informed the clinical detail throughout this article and are worth bookmarking for direct reference.
- Insulin Resistance - StatPearls - NCBI Bookshelf
- Measuring and estimating insulin resistance in clinical and research settings - PMC
- Comparative performance of invasive, semi-invasive, and non-invasive insulin resistance-related indices across prediabetes and normoglycemia | PLOS One
This article is general information, not a substitute for advice from a qualified doctor. Consult a qualified healthcare professional about your own circumstances before acting on anything here.
FAQ
What Are the Main Blood Markers for Insulin Resistance?
The core blood markers are fasting glucose, fasting insulin, and the indices calculated from them, HOMA-IR, QUICKI, and TyG, plus a standard lipid panel for TG/HDL and related composite scores. Hemoglobin A1c and hs-CRP often round out a fuller metabolic workup, though neither diagnoses insulin resistance on its own, a point LabTestsOnline emphasizes when describing how clinicians interpret these results together rather than individually.
What Are Common Physical Signs of Insulin Resistance?
Physical signs include increased waist circumference, skin changes like acanthosis nigricans (dark, velvety patches typically at the neck or armpits), skin tags, and difficulty losing weight despite consistent effort. Fatigue after meals, increased hunger, and irregular menstrual cycles in women with underlying PCOS are also commonly reported, though none of these signs confirm the diagnosis without corroborating lab work.
What Is the Fastest Way to Improve Insulin Resistance?
There’s no single fastest fix, but the interventions with the strongest evidence base are resistance and aerobic exercise, reducing visceral fat specifically, and improving diet quality, particularly reducing refined carbohydrate and added sugar intake. Pairing lifestyle changes with body-composition tracking, such as a DEXA Scan, shows whether an intervention is reducing visceral fat rather than just shifting the number on a scale.
How Do I Know if My HOMA-IR Result Is Actually High?
There is no universal HOMA-IR cutoff, since normal ranges shift based on your lab’s insulin assay and the population used to establish that lab’s reference range. A result should be interpreted alongside fasting glucose, lipid panel results, and clinical context, ideally tracked over time with the same lab and assay rather than compared once against a generic published threshold.
Can Dexaslim Testing Help Track Insulin Resistance Markers?
Dexaslim’s DEXA Scan and Longevity Panel don’t replace a fasting insulin or HOMA-IR calculation, but they add visceral fat and lean mass data that helps explain what’s driving a biomarker trend. That combination is particularly useful for patients tracking progress through a weight-loss or metabolic health program over several months.